April 30, 2025
– 8 minute read
Unlock customer loyalty analytics to boost retention, reduce churn, and drive growth with data-driven insights from key financial, engagement, and behavior metrics.

Cormac O’Sullivan
Author

Customer loyalty is one of the most valuable assets a business can have. Loyal customers don’t just buy more they promote your brand, cost less to retain, and help drive steady growth. But how can businesses know if their loyalty efforts are working? This is where customer loyalty analysis comes in.
By tracking how customers engage with your brand, you gain insight into their satisfaction, purchase behavior, and risk of churn. A deep understanding of these trends helps improve the customer experience, strengthen loyalty programs, and support your overall marketing efforts.
Businesses can’t afford to guess what keeps customers engaged. Instead, you need data-driven insights to create strong customer segments, tailor communication, and identify what drives long-term loyalty.

What Is Customer Loyalty Analysis?
Customer loyalty analysis is the process of examining customer data to measure how committed customers are to your brand. It helps identify your most loyal customers, spot those at risk of leaving, and understand how to turn more people into brand advocates.
Key Customer Loyalty Metrics
To understand loyalty, businesses need to track specific customer loyalty metrics across three main areas: financial, engagement, and behavior.
Financial metrics
Show how much value a customer brings over time. These include figures like customer lifetime value (CLV), average order value (AOV), and customer acquisition cost (CAC). They help measure the return on your marketing efforts and loyalty programs.
Engagement metrics
Reflect how emotionally connected and involved customers are with your brand. These include the net promoter score (NPS), customer satisfaction score (CSAT), and social media engagement, giving insight into customer sentiment and feedback.
Behavioral metrics
Track what customers actually do how often they buy, if they return products, and how often they interact with your brand. This reveals patterns in customer behavior, helping businesses spot risk of churn and increase retention.
Financial Metrics for Customer Loyalty Analysis
Financial metrics are key indicators of how valuable your customers are over time. These metrics not only reveal the impact of loyalty programs and marketing efforts, but also help businesses understand where to invest for higher returns. Let’s break down four essential financial metrics used in customer loyalty analysis:
Customer Lifetime Value (CLV)
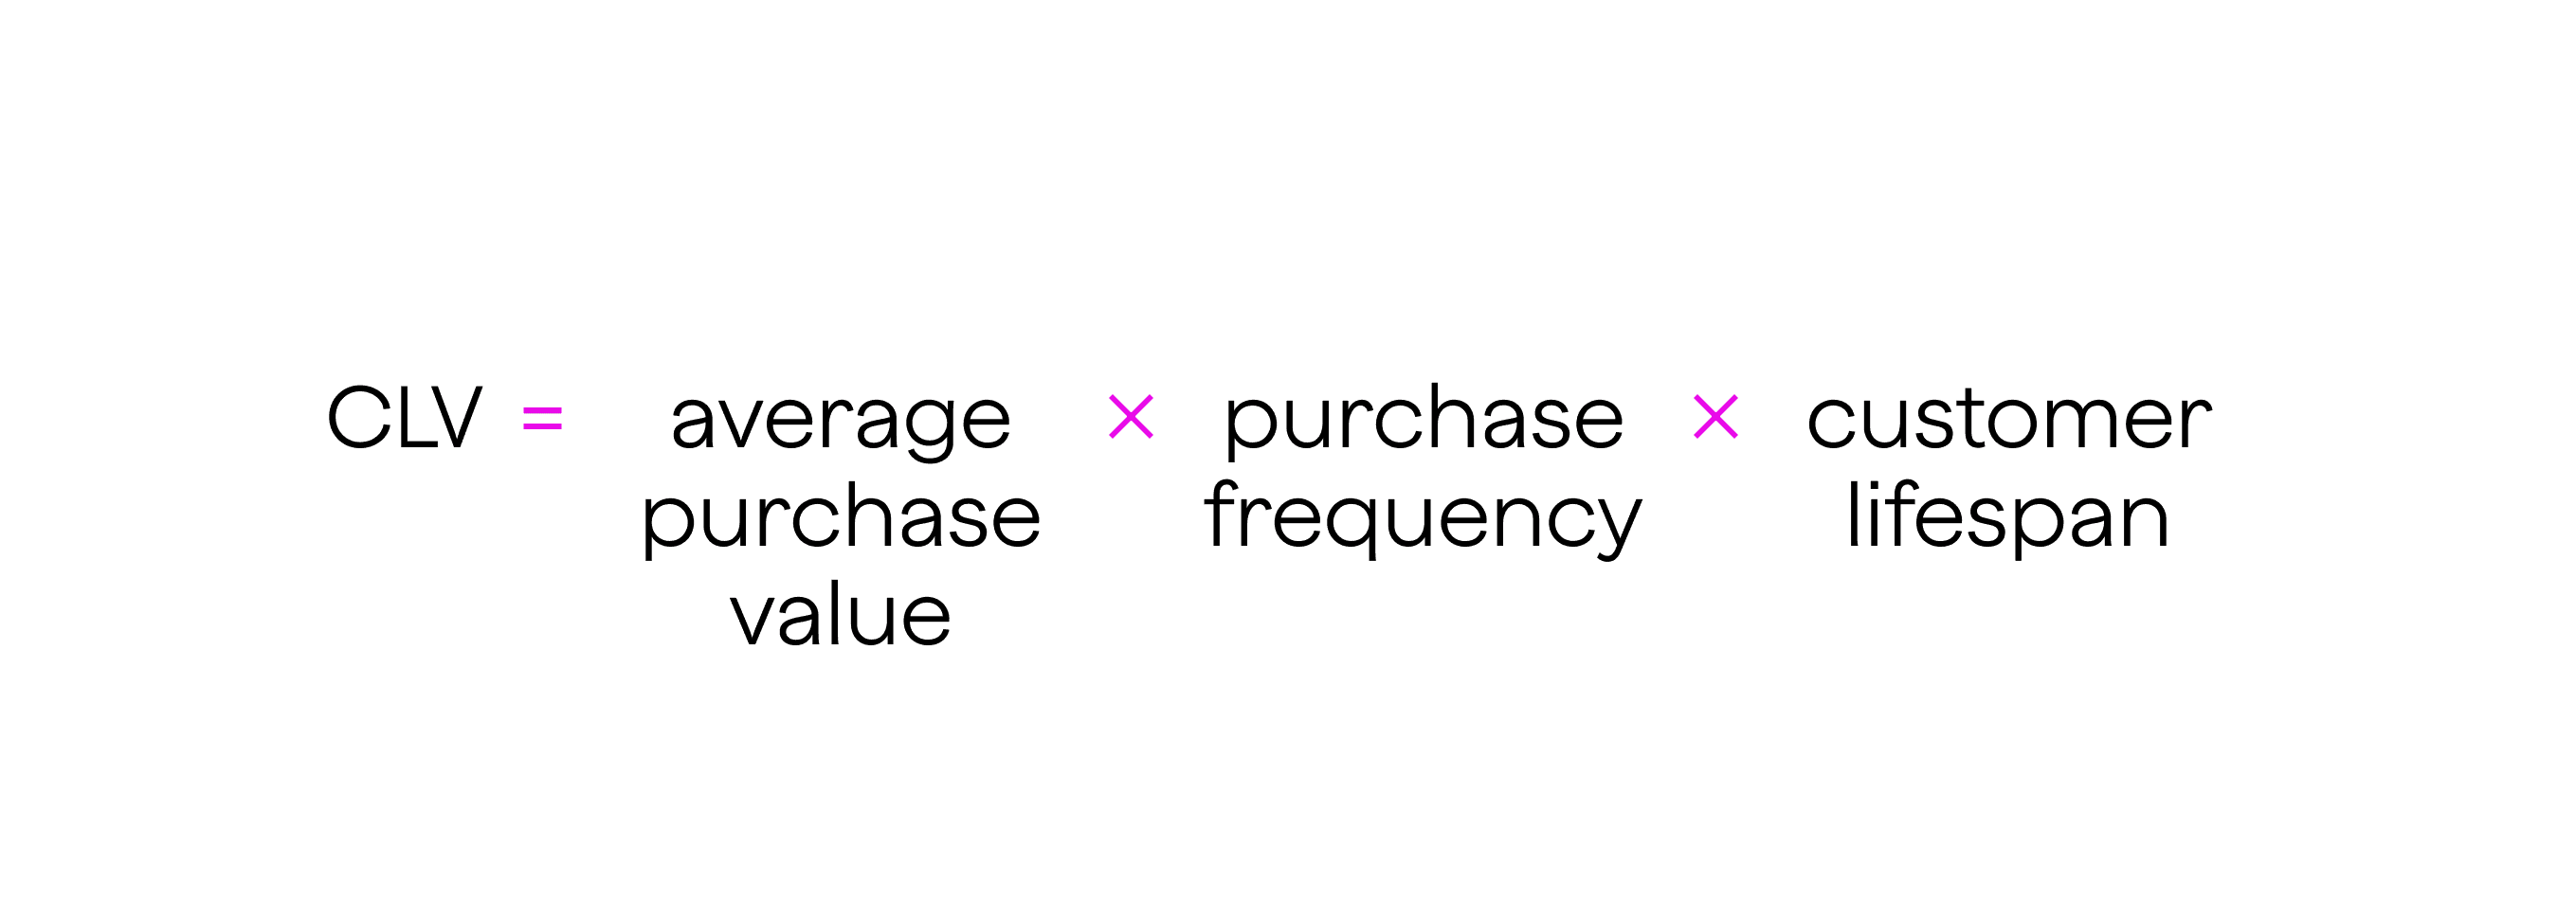
Customer Lifetime Value (CLV) measures how much revenue a single customer is expected to generate during their relationship with your brand. It helps you understand which customer segments are most valuable and worth nurturing.
For example, if a customer spends $100 per order, shops six times a year, and stays loyal for five years, their CLV would be $3,000. This makes CLV a powerful tool for targeting high-value loyal customers and designing better customer experiences.
A high CLV typically indicates high customer satisfaction, strong retention, and low customer churn. Companies like Amazon use CLV to identify frequent shoppers and reward them through tailored offers, fast shipping, and Prime benefits.
Repeat Purchase Rate (RPR)
Repeat Purchase Rate (RPR) measures the percentage of customers who make more than one purchase. A high RPR signals strong customer loyalty and effective engagement strategies.
For example, if out of 1,000 customers, 400 made a second purchase, your RPR would be 40%. This metric helps businesses see how well they are turning first-time buyers into brand advocates.
Increasing RPR often involves improving the purchase experience, offering exclusive deals, or personalizing communication based on purchase history. Brands that do this well enjoy a more stable number of customers over time.

Average Order Value (AOV)
Average Order Value (AOV) shows how much customers typically spend per transaction. It’s calculated by dividing total revenue by the total number of orders over a specific period.
A high AOV means your customers are spending more each time they shop. This can indicate strong trust in your brand and a willingness to invest in your products or services. For instance, by recommending complementary items or offering discounts on bundles, businesses can encourage higher AOV.
Analyzing AOV alongside CLV can help identify which customer behaviors lead to greater profitability. You can use these insights to boost customer loyalty by tailoring upselling and cross-selling strategies.
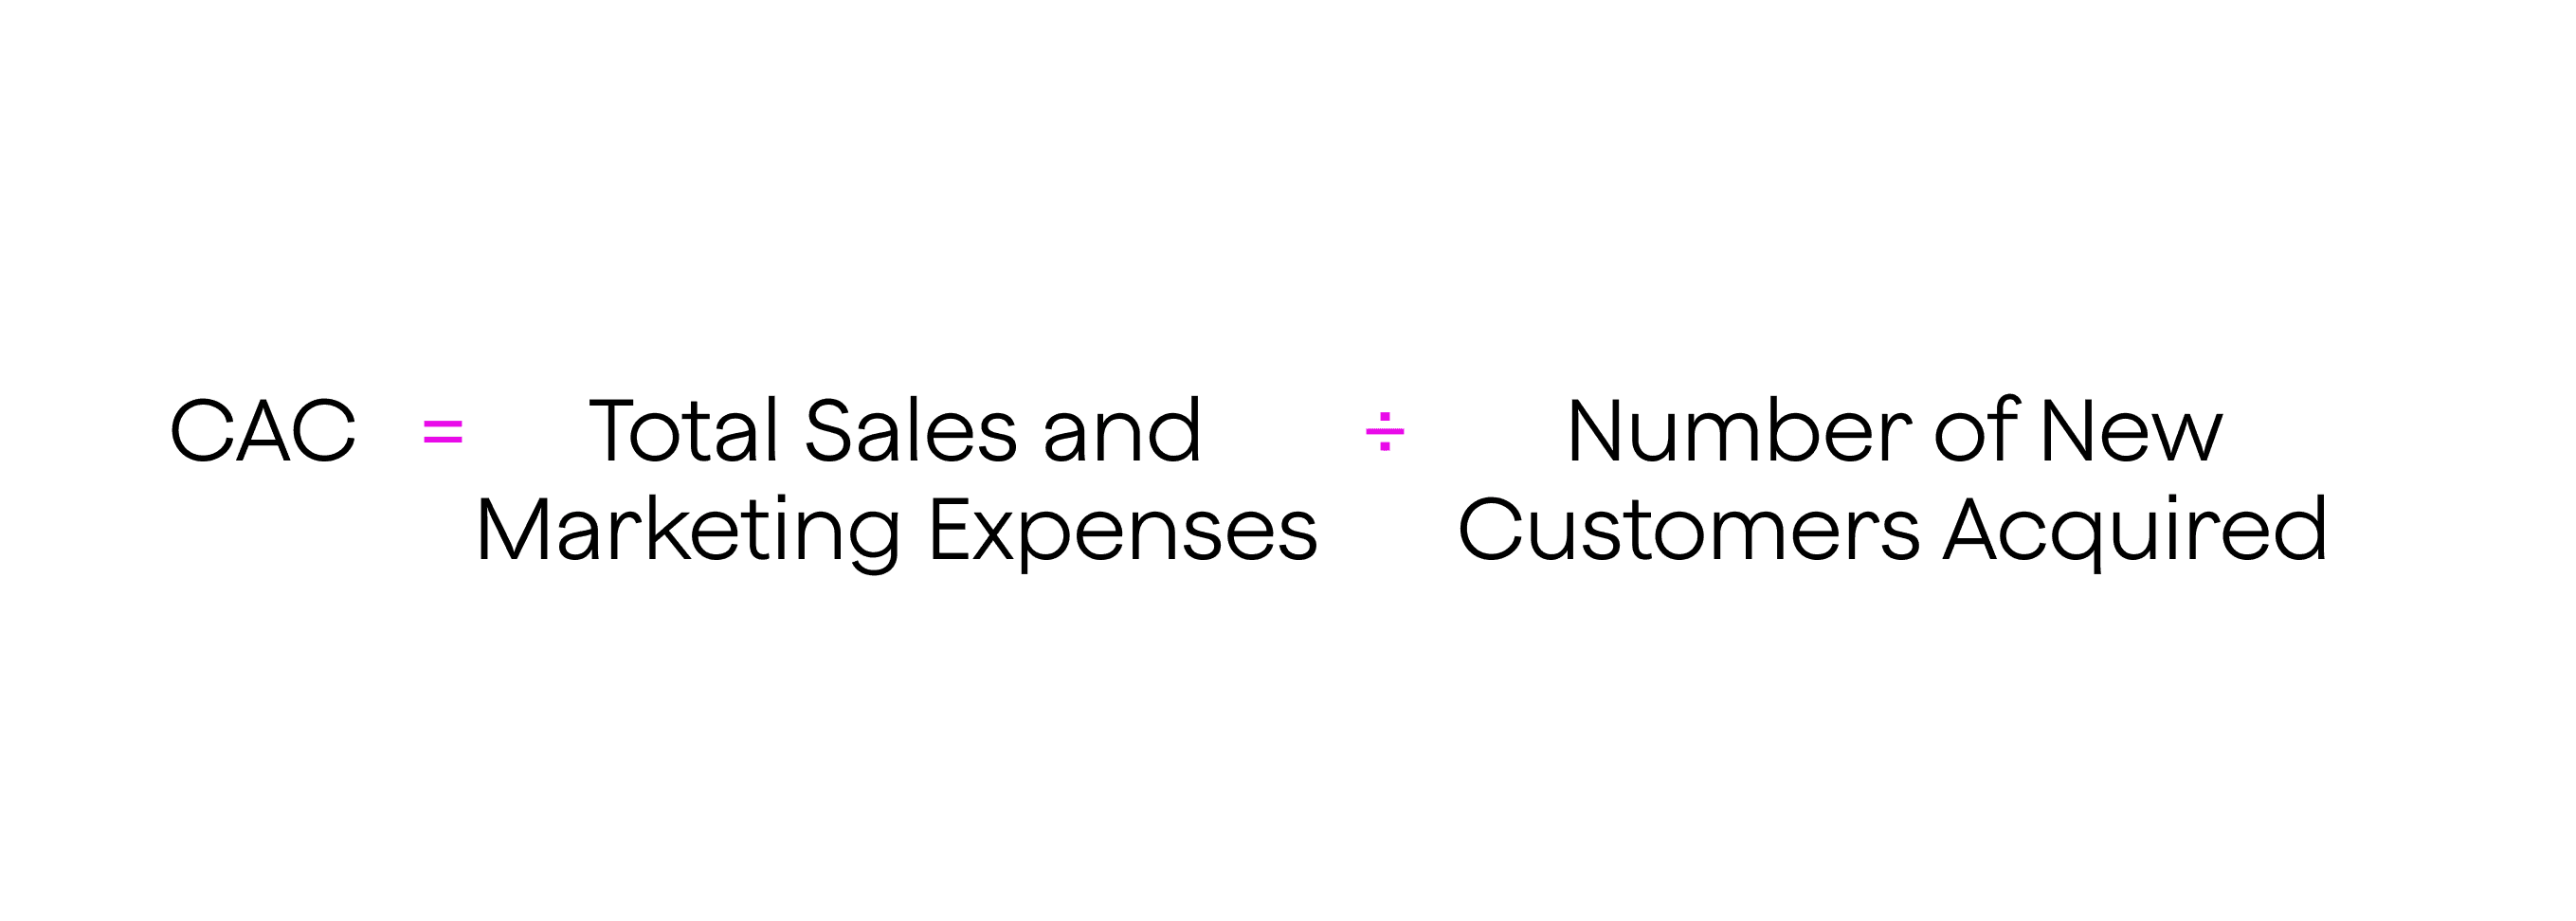
Customer Acquisition Cost (CAC)
Customer Acquisition Cost (CAC) tells you how much it costs to acquire a new customer. It includes expenses like advertising, sales, and promotions. To get the most out of your CAC, compare it with CLV. If CAC is higher than CLV, you’re losing money even if sales seem strong.
Keeping CAC low while maintaining a high CLV is key to long-term business success. This balance ensures that your customer segments are not just growing in size but also in value.
Brands that focus on loyalty often see lower CAC because loyal customers refer others, reducing the need for expensive marketing. In fact, referred customers tend to spend more and stay longer.
Engagement Metrics for Customer Loyalty Analysis
Engagement metrics help measure how emotionally connected and satisfied your customers are. These indicators reflect how likely your customers are to return, recommend your brand, or interact with you online. Strong engagement often leads to higher retention, lower customer churn, and more brand advocates. Below are four essential engagement metrics used in customer loyalty analysis:
Net Promoter Score (NPS)
The Net Promoter Score (NPS) is a widely used metric that asks one key question: “How likely are you to recommend us to a friend or colleague?” Responses are scored from 0 to 10, and customers are grouped as:
Promoters (9–10): Loyal enthusiasts who refer others
Passives (7–8): Satisfied but not enthusiastic
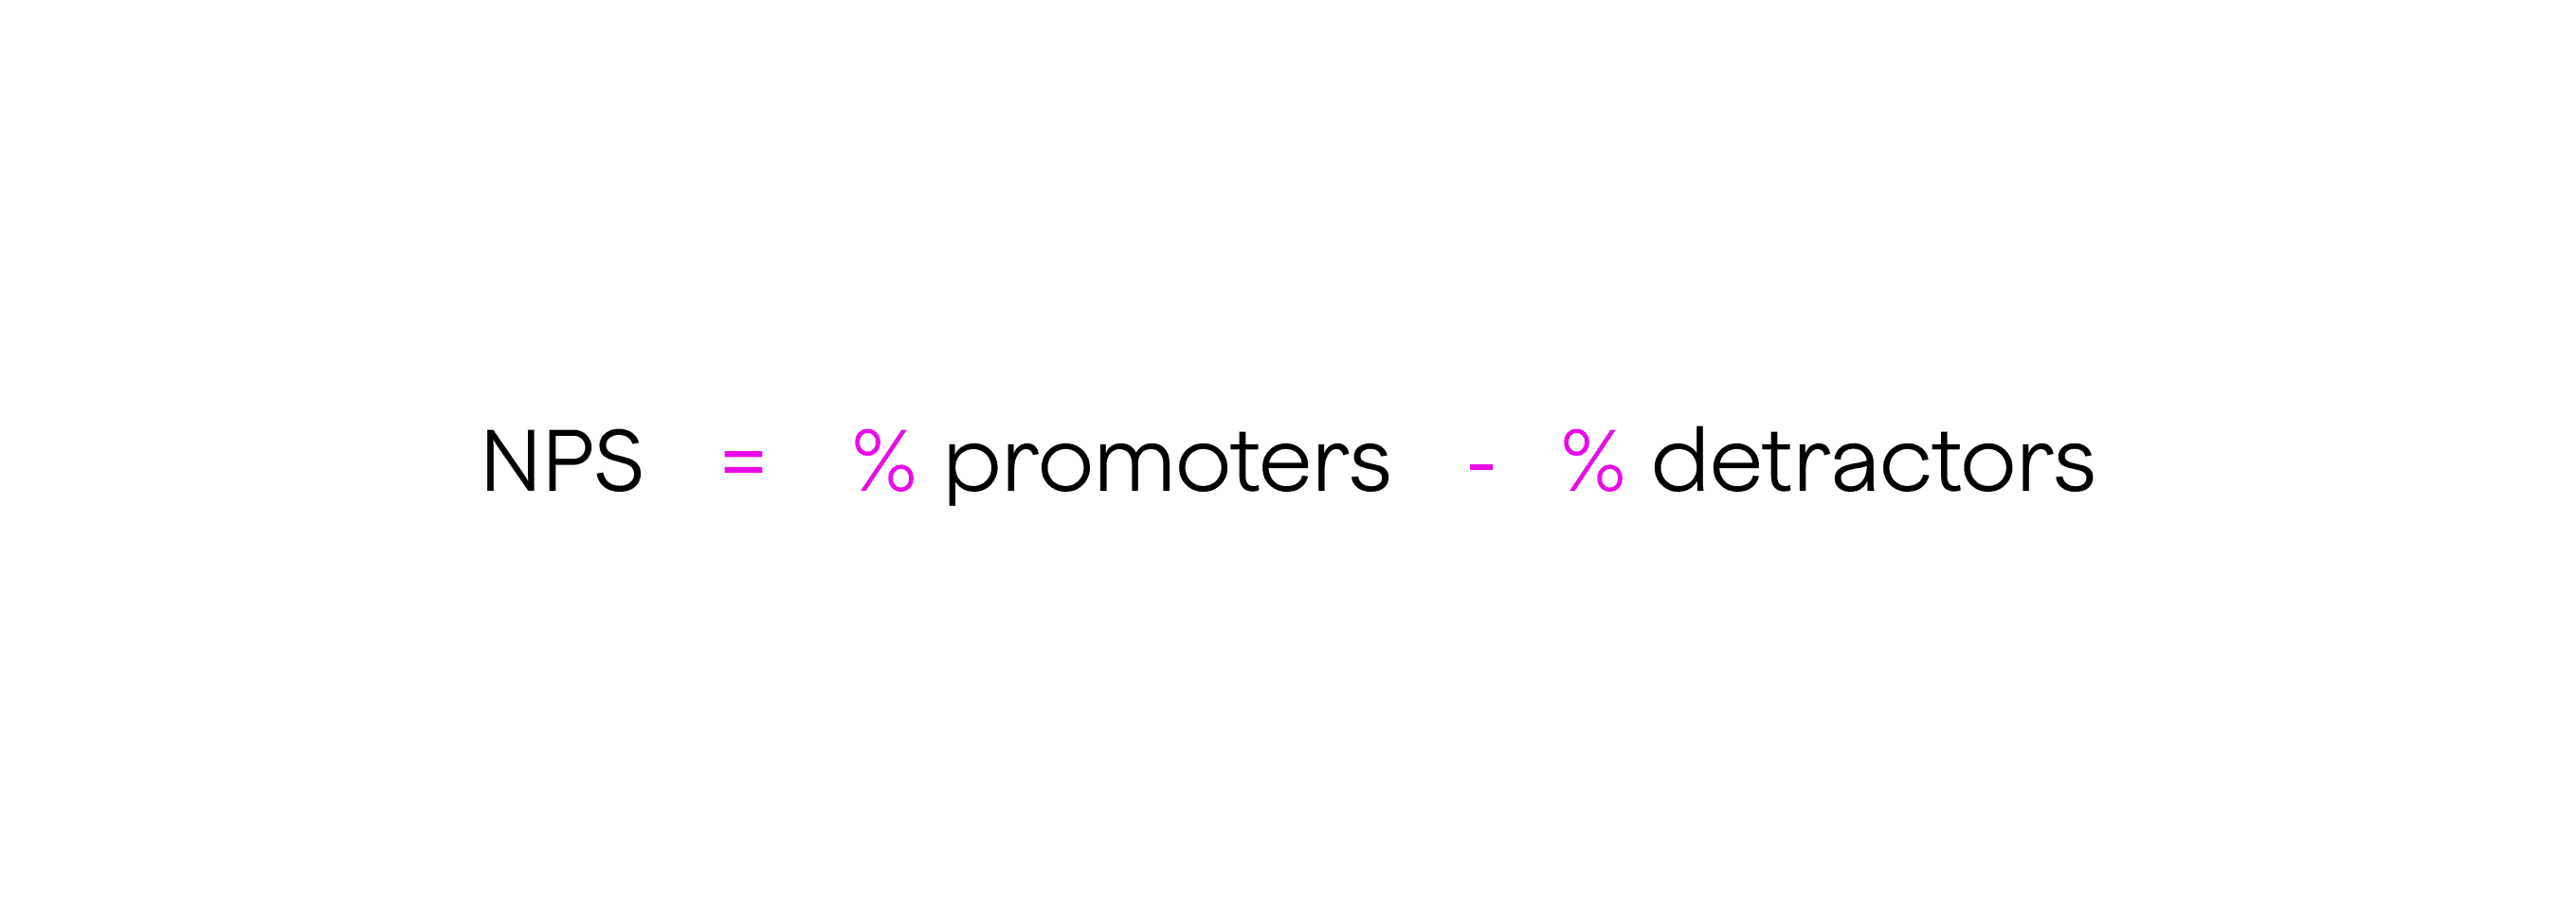
Detractors (0–6): Unhappy customers are likely to churn
Your NPS is calculated by subtracting the percentage of detractors from the percentage of promoters. A high NPS means your customer experience is strong and that customers are willing to act as brand advocates.
According to Bain & Company, companies with high NPS scores often see higher growth and better long-term customer relationships.
Customer Satisfaction Score (CSAT)
Customer Satisfaction Score (CSAT) measures how happy customers are with a specific interaction, product, or service. It usually asks, “How satisfied were you with your experience?” and is scored on a scale of 1 to 5.
CSAT is a useful tool for identifying strengths and weak points in your customer journey. A high CSAT means your support, product quality, or service is meeting expectations. A low score signals a need for quick improvements.
Unlike NPS, CSAT is more focused on short-term satisfaction. But it’s equally valuable in improving customer sentiment and increasing the chance of turning a first-time buyer into a loyal customer.
Customer Effort Score (CES)
Customer Effort Score (CES) measures how easy it was for a customer to complete a task, such as finding information, getting support, or completing a purchase. The standard question is: “How easy was it to solve your problem today?”
A lower effort score indicates a smoother customer experience, which directly impacts customer loyalty. Research from Harvard Business Review shows that reducing customer effort is a better predictor of loyalty than delighting customers.
By simplifying processes, streamlining support, and removing friction points, businesses can boost CES and keep more customers engaged.
Social Media Engagement
Social media engagement reflects how actively customers interact with your brand on platforms like Instagram, Facebook, X (formerly Twitter), and LinkedIn. This includes likes, comments, shares, mentions, and direct messages.
Tracking social engagement helps measure how emotionally connected your audience feels. It also shows whether your content resonates with your customer segments and how many loyal customers are actively participating in brand conversations.
High engagement rates indicate a vibrant and connected community. Tools like Sprout Social or Hootsuite can help track these interactions and tie them back to customer behavior.
Social media engagement also supports real-time customer feedback, allowing you to respond quickly, build trust, and humanize your brand.
Behavioral Metrics for Customer Loyalty Analysis
Behavioral metrics reveal how customers act rather than how they feel. While engagement metrics measure sentiment, behavioral indicators show patterns in customer behavior that help you identify loyalty trends, risks, and opportunities. These metrics are essential in assessing customer retention, predicting customer churn, and improving your overall customer experience. Below are four critical behavioral metrics to track:
Purchase Frequency
Purchase frequency measures how often a customer buys from your business within a specific time frame. It gives you a clear picture of how regularly your customers engage with your brand.
High purchase frequency usually indicates strong customer satisfaction and loyalty. It often signals that your products or services are becoming part of the customer’s routine. If customers return to buy often, your loyalty programs and communication strategies are likely effective.

To calculate it, divide the total number of orders by the number of unique customers over a given period. For example, if 500 orders were made by 200 customers in a month, the purchase frequency is 2.5.
Understanding this metric allows you to segment high-frequency shoppers for targeted offers, which can further boost customer lifetime value (CLV) and drive long-term business success.
Customer Retention Rate (CRR)
Customer Retention Rate (CRR) shows the percentage of customers a business retains over time. It reflects how well your brand keeps existing customers engaged and satisfied.
To calculate CRR, use the formula:

Where:
E = number of customers at the end of the period
N = new customers acquired
S = customers at the start of the period
A high CRR means customers are sticking with your brand, while a low rate could signal a risk of churn.
Research shows that increasing retention by just 5% can increase profits by 25% to 95%. That’s why tracking CRR is vital for identifying areas where your customer experience or product quality may need improvement.
Product Return Rate
Product return rate measures the percentage of products that customers return after purchase. While some returns are normal, a high return rate can suggest dissatisfaction, misleading product descriptions, or quality issues.
It’s calculated by dividing the number of returned products by the total number sold. For example, if 100 out of 1,000 items were returned, your return rate is 10%.
Tracking this helps reduce operational costs and improves satisfaction. If specific customer segments return items more frequently, it may indicate the need for better product recommendations, sizing guides, or clearer policies.
According to Statista, e-commerce return rates in the U.S. average around 20.8%, highlighting how critical it is to manage returns effectively to protect your profit margins and maintain customer loyalty.

Active User Rate
Active user rate measures the percentage of users who interact with your platform or service within a defined period (daily, weekly, or monthly). It’s especially useful for digital platforms, apps, and subscription-based services.
An active user is someone who logs in, clicks, views, or makes a purchase anything that shows genuine interaction. A drop in active users may indicate a decline in engagement or usability issues.
High active user rates are signs of a healthy user base and strong customer loyalty. When tracked consistently, this metric reveals whether your updates, campaigns, or features are keeping users engaged.
Tools like Mixpanel or Amplitude can help businesses dig deeper into usage patterns, which can then be used to personalize experiences and reduce churn.
Conclusion
Customer loyalty analysis is essential for understanding what drives repeat business and long-term value. By tracking financial, engagement, and behavioral customer loyalty metrics, businesses can identify their most valuable customer segments, reduce customer churn, and improve the overall customer experience.
Metrics like CLV, NPS, CRR, and purchase frequency offer clear, actionable insights into loyalty and satisfaction. With the right data, brands can tailor their marketing efforts, enhance loyalty programs, and turn satisfied customers into brand advocates. In today’s competitive market, leveraging customer data is key to building lasting relationships and ensuring sustained business success.