July 16, 2025
– 6 minute read
Discover the top marketing KPIs for restaurants to track performance, boost profits, and make smarter data-driven decisions that improve customer experience.

Cormac O’Sullivan
Author

What Is Marketing KPIs for Restaurants?
Marketing KPIs for restaurants are specific measurements that track how well your marketing efforts are performing. These key performance indicators (KPIs) help restaurant managers understand what drives customers through the door, what makes them return, and how marketing impacts the bottom line.

Why Is Measuring KPIs in the Restaurant Business Important?
Tracking key performance indicators (KPIs) is crucial for success in the restaurant industry. Without clear performance metrics, restaurant managers are left guessing about what works and what doesn’t. Measuring KPIs helps you monitor total sales, control food costing, and manage cash flow.
It also reveals how marketing impacts customer behavior, such as repeat visits or online reviews. By focusing on the right key metrics, you can improve customer satisfaction scores, reduce staff turnover, and maximize profit margins. Ultimately, KPIs give you the insights needed to make data-driven decisions that help grow your restaurant's profit and long-term success.
10 Key Performance Indicators (KPIs) for Restaurants
Gross profit margin
Gross profit margin is a key metric that shows the percentage of revenue left after subtracting the cost of goods sold (COGS). It indicates how efficiently a restaurant produces and sells its menu items. A healthy gross profit margin means you’re earning well on each sale before covering other expenses like rent or staff wages.
Formula:
Gross Profit Margin (%) = [(Total Sales – Cost of Goods Sold) ÷ Total Sales] × 100
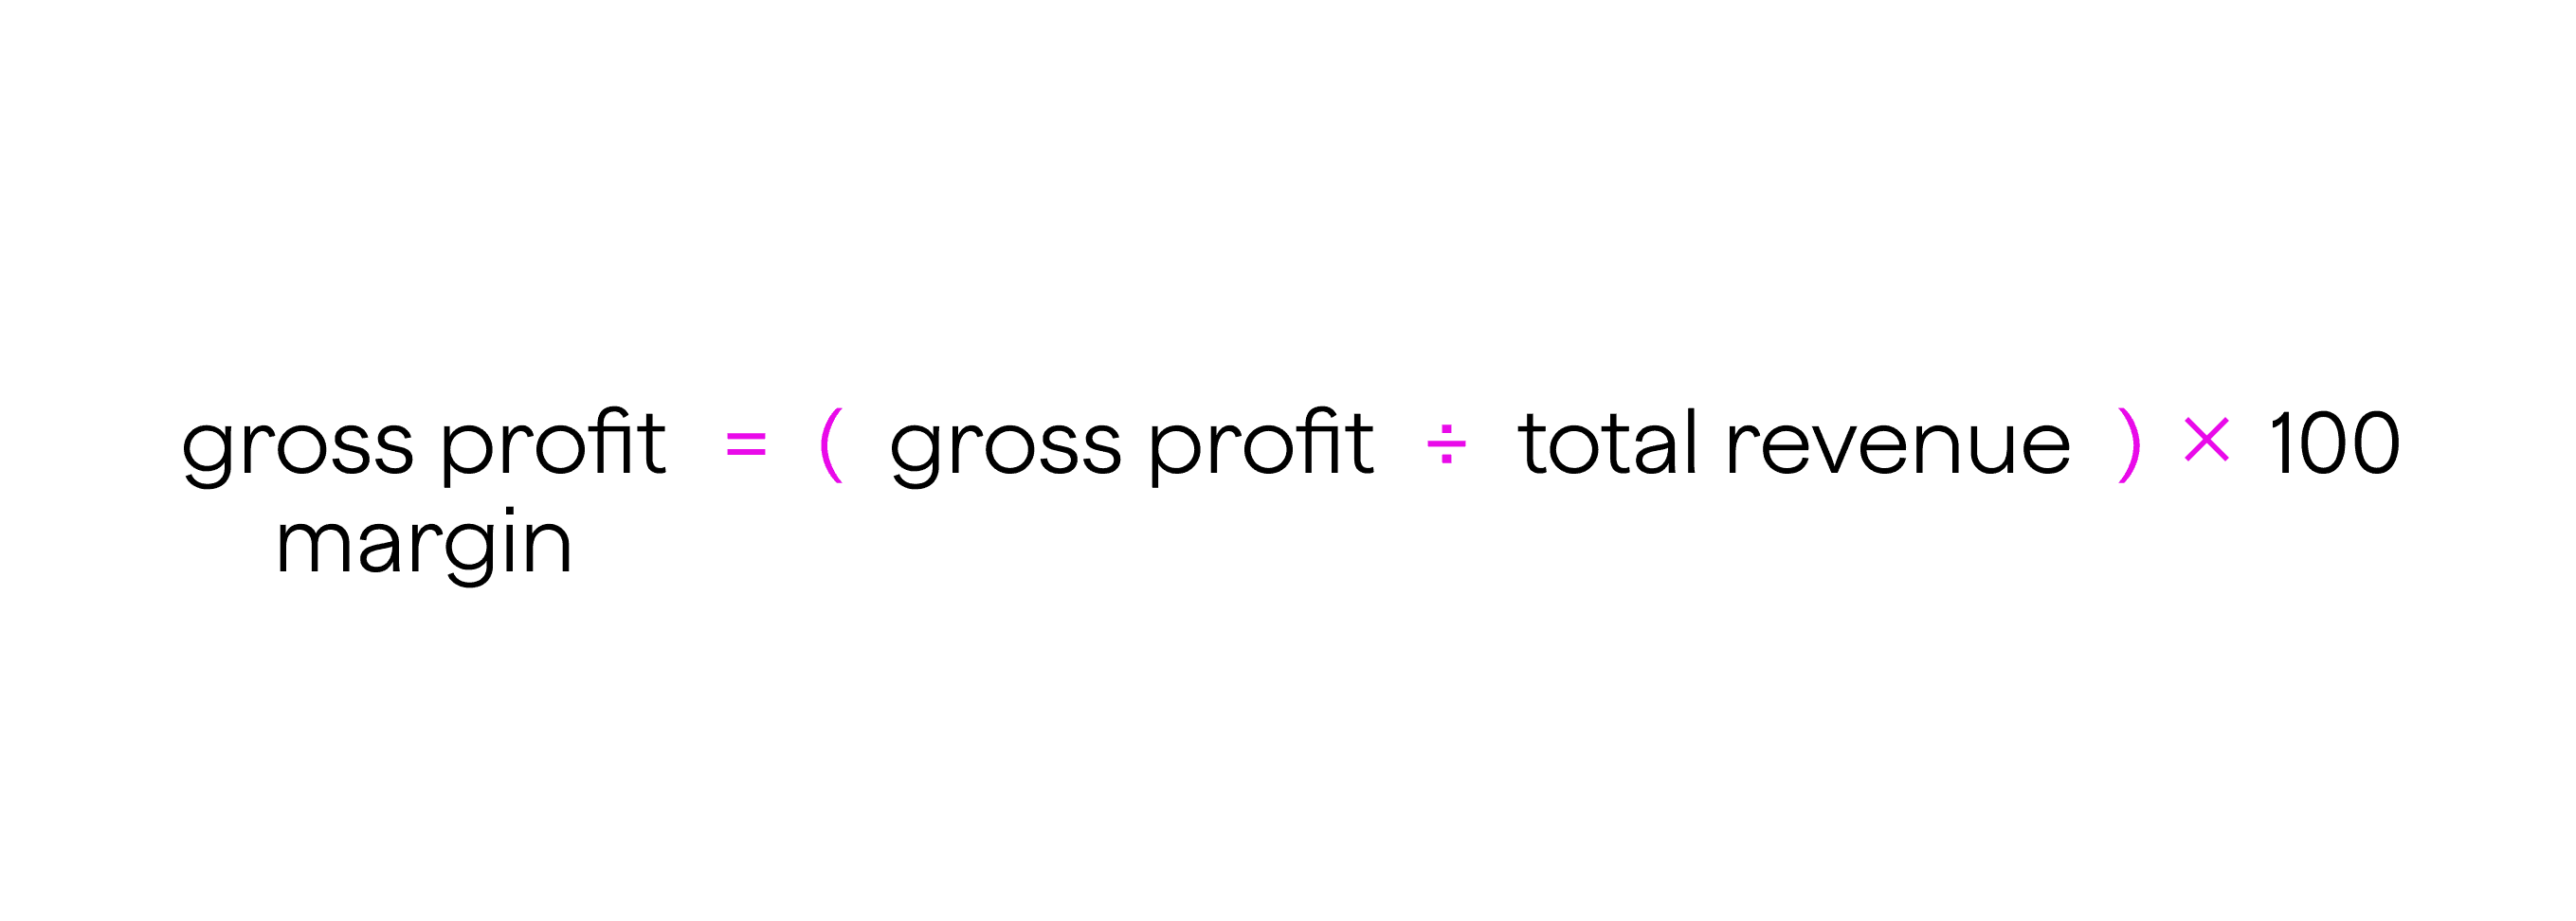
Tracking this KPI helps restaurant managers control food costing and improve profit margins, which are vital to the restaurant’s financial health.
Net Profit Margin
Net profit margin measures the percentage of revenue that remains as profit after all expenses are paid. This includes total fixed costs, labor, rent, utilities, and marketing. It shows how much money the restaurant actually keeps from its sales.
Formula:
Net Profit Margin = (Net Profit ÷ Total Sales) × 100
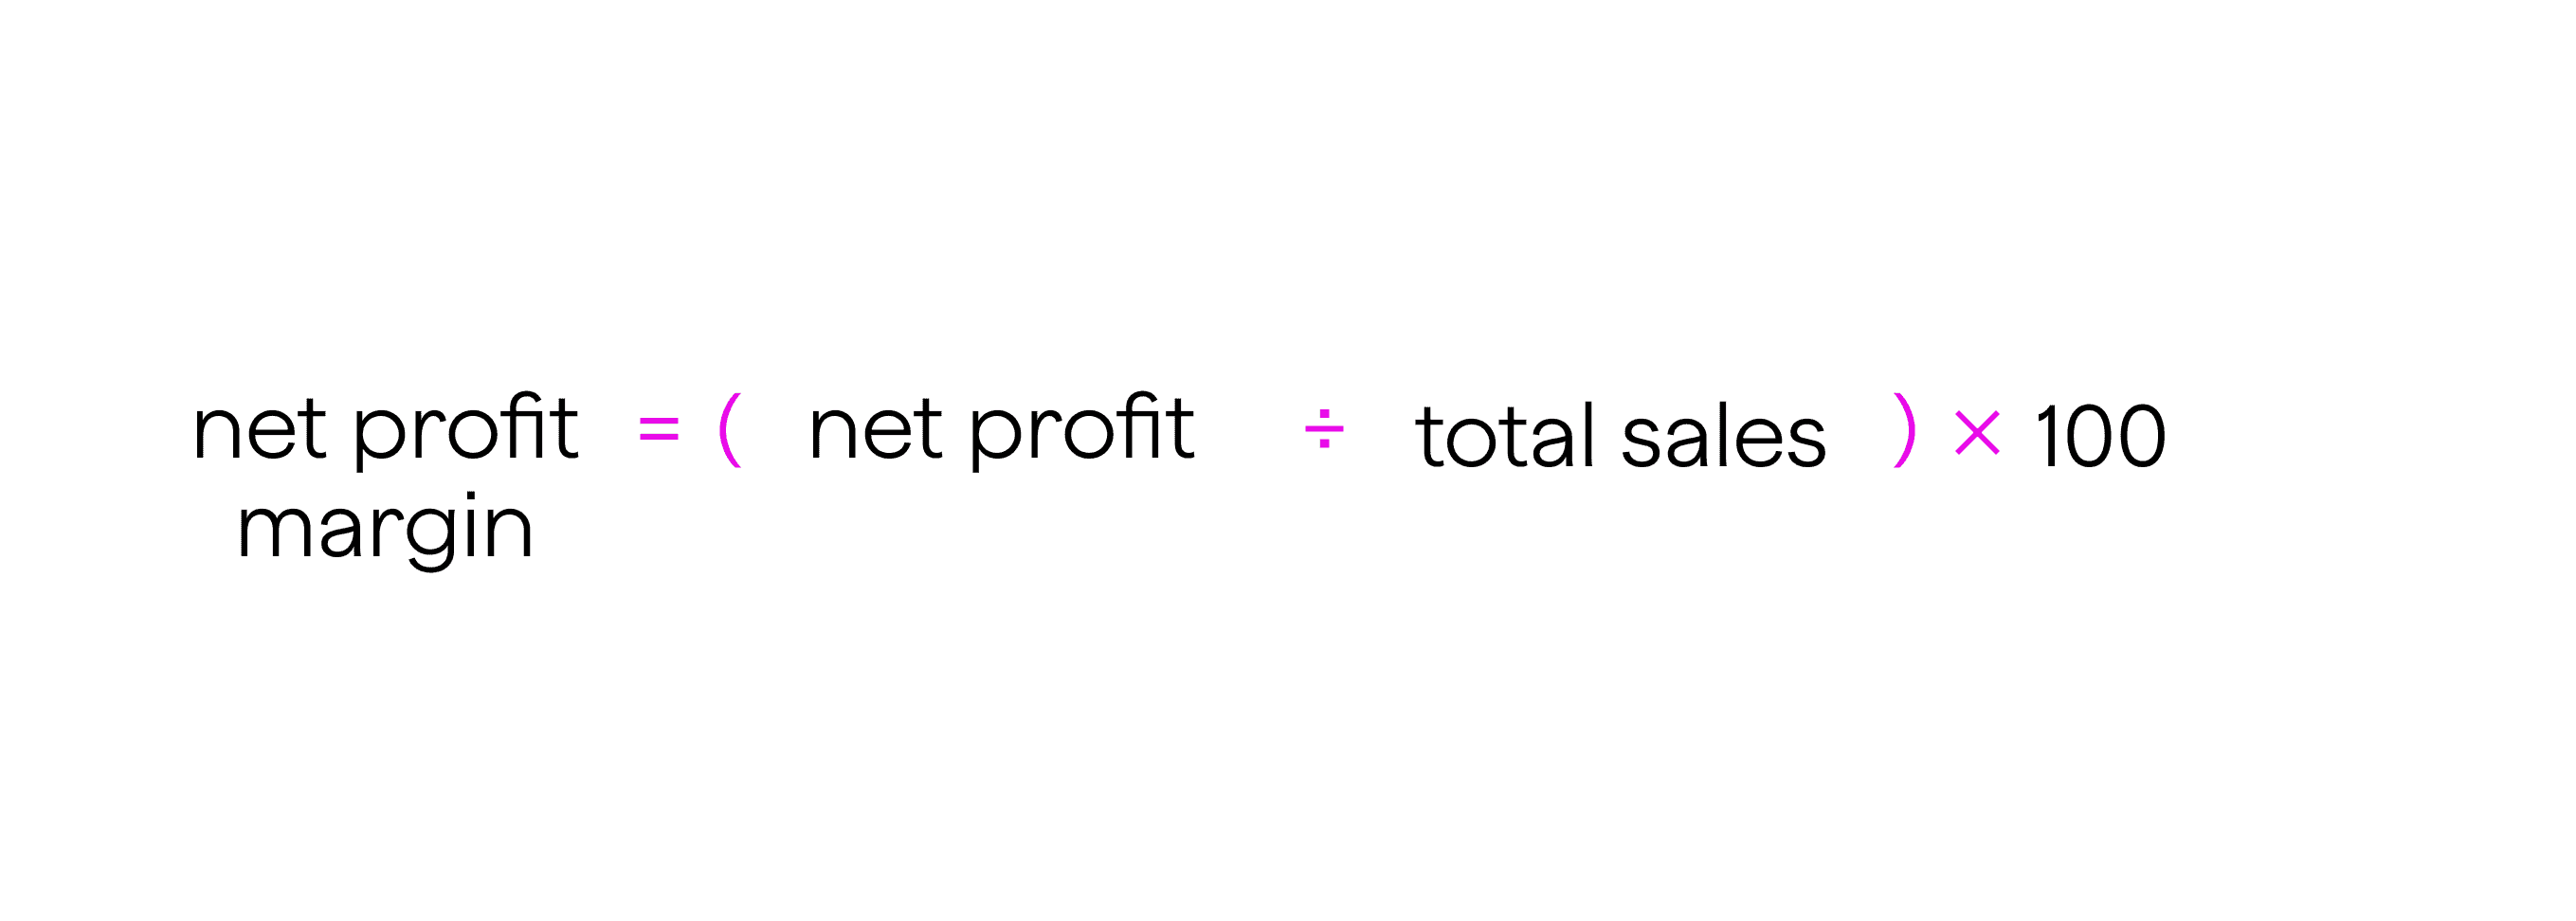
A higher net profit margin means the restaurant is managing costs well and generating real profits. This KPI is crucial for understanding overall business health and guiding data-driven decisions to improve restaurant profit and sustainability.
Average Covers
Average covers refer to the number of customers served during a specific period, usually daily or weekly. This KPI helps restaurants understand customer flow and table turnover, which directly impacts total sales and revenue.
Formula:
Average Covers = Total Number of Customers ÷ Number of Service Periods (e.g., days)
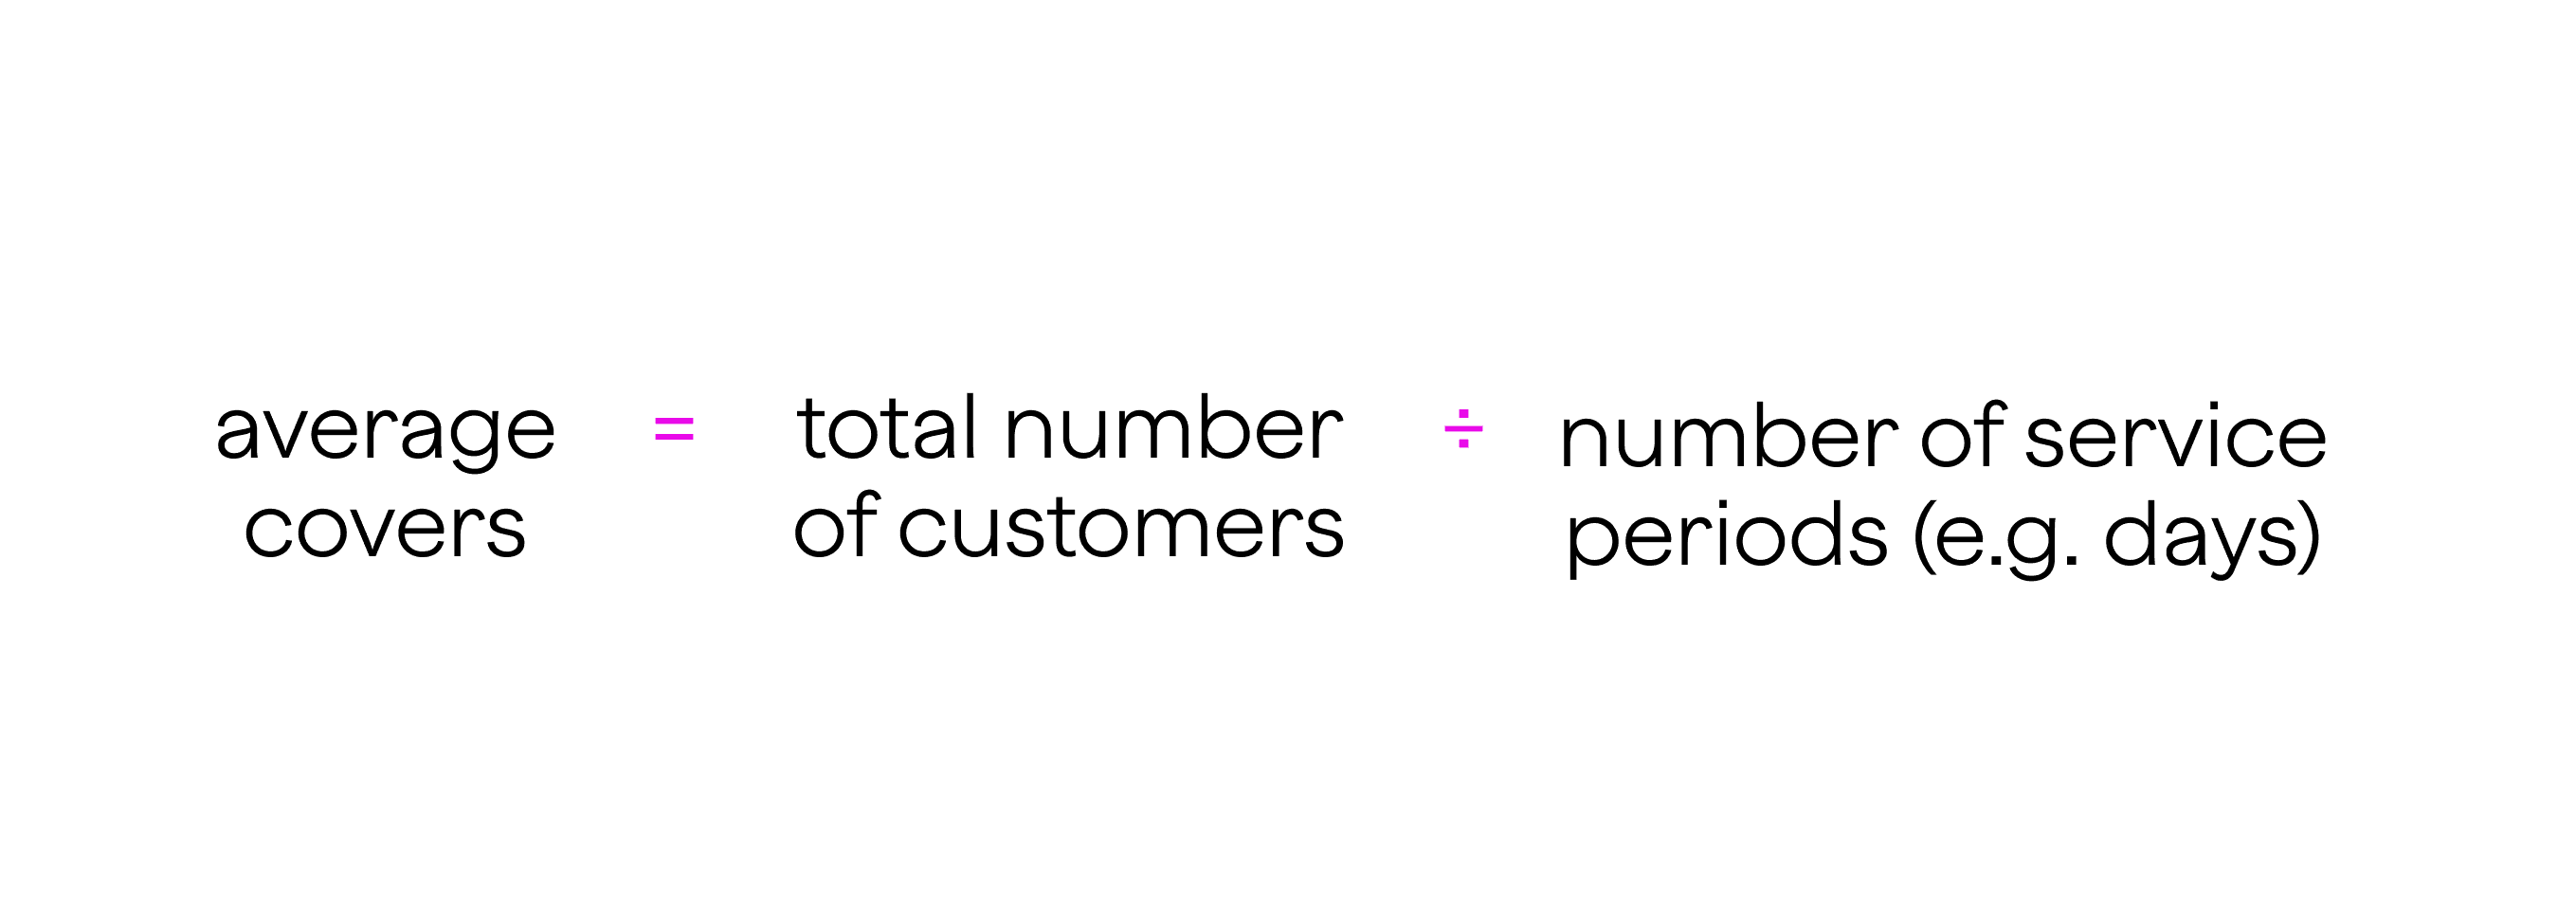
Tracking average covers allows a restaurant manager to optimize staffing and seating arrangements, improving the customer experience and increasing efficiency. Knowing this metric helps balance demand and capacity to maximize revenue without compromising service quality.
Cost of Goods Sold (COGS)
Cost of Goods Sold (COGS) represents the total cost of all ingredients and materials used to prepare menu items sold during a specific period. It’s a vital KPI for managing food costing and maintaining healthy profit margins.
Formula:
COGS = Beginning Inventory + Purchases – Ending Inventory

By closely tracking COGS, restaurant managers can identify waste, theft, or inefficient purchasing. Keeping COGS under control ensures better pricing strategies and helps improve the gross profit margin, directly impacting the restaurant’s profitability.
Food Cost Percentage
Food cost percentage shows how much of your total sales revenue is spent on food ingredients. It’s a critical KPI for managing food costing and ensuring profitability.
Formula:
Food Cost Percentage (%) = (Cost of Goods Sold ÷ Total Food Sales) × 100
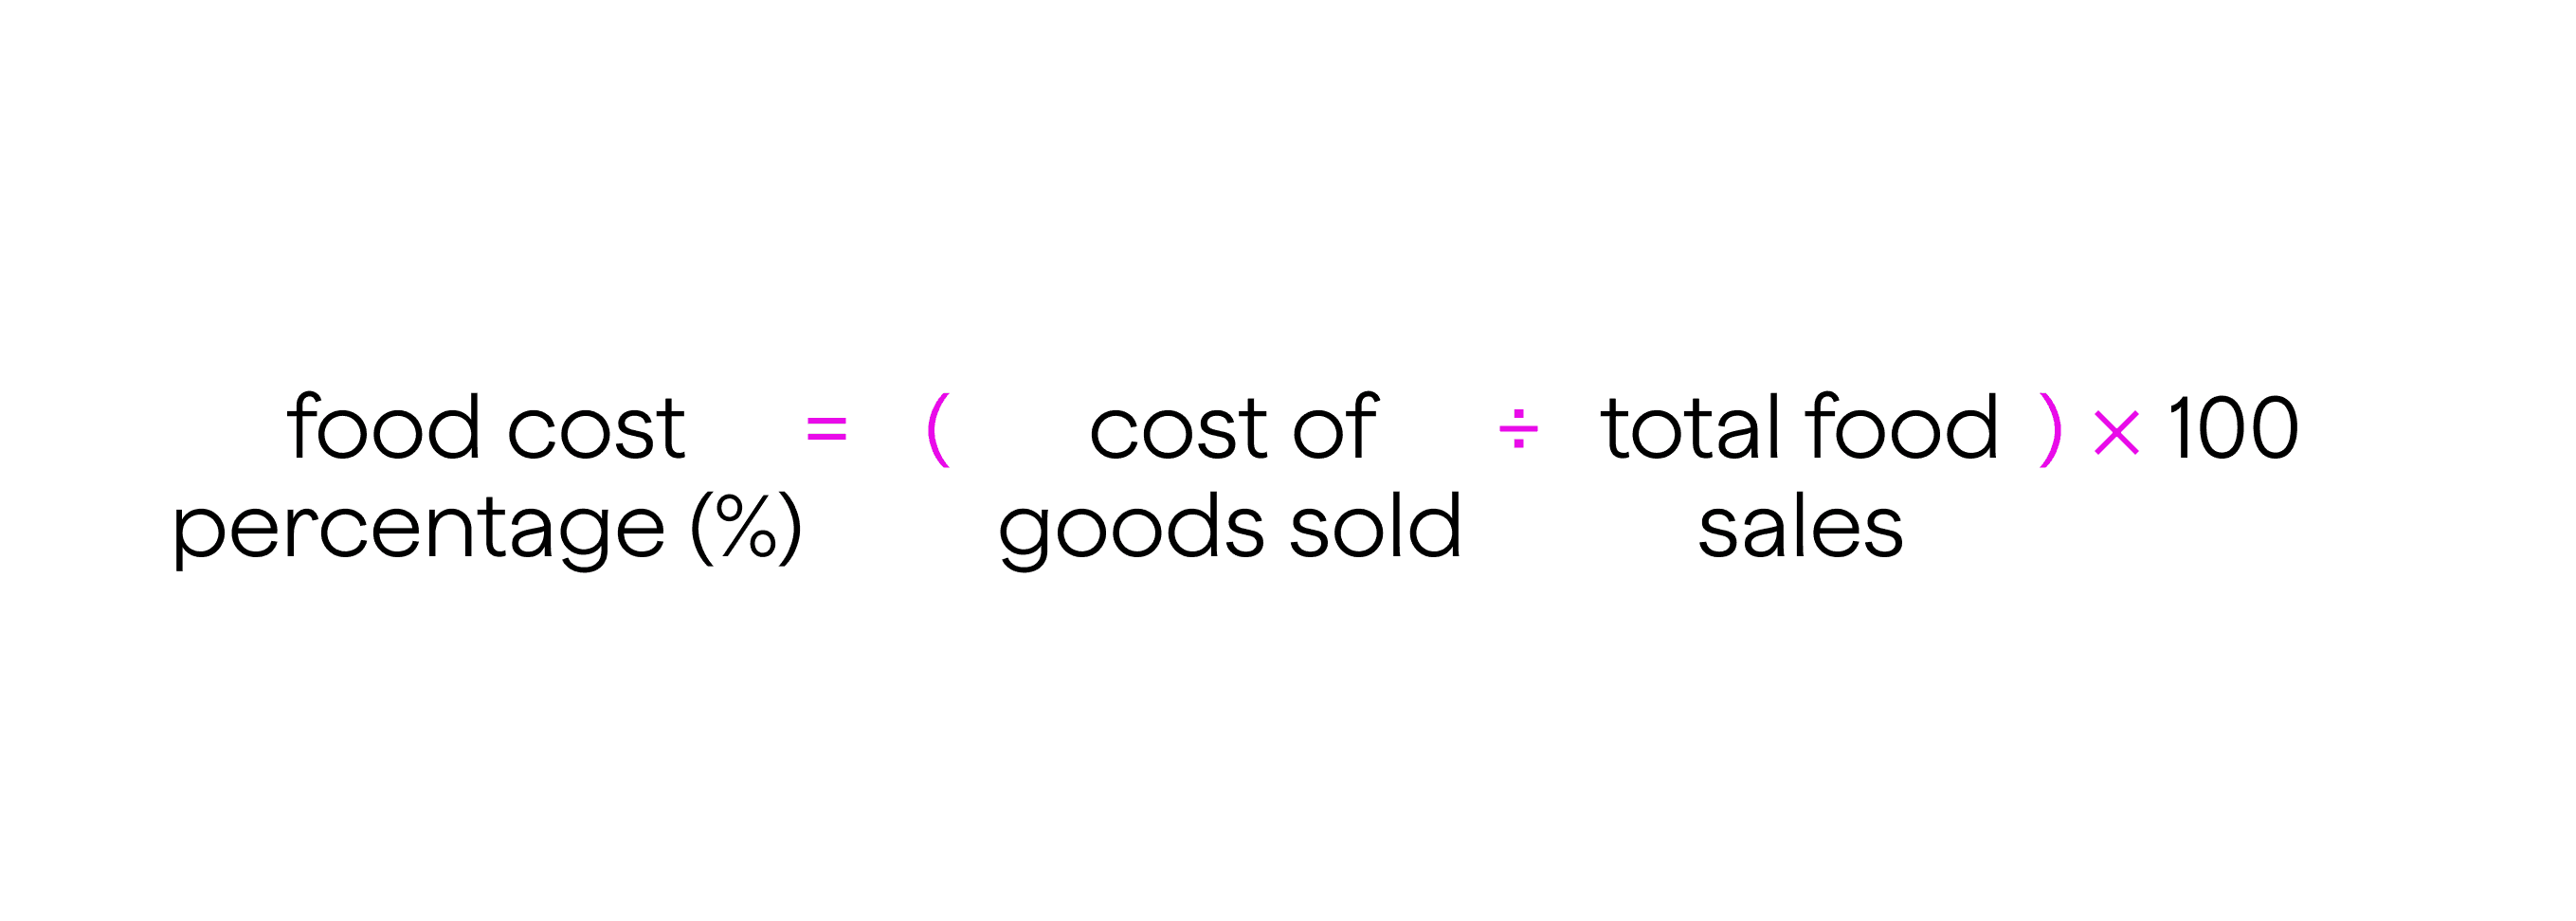
Maintaining a reasonable food cost percentage usually between 28% and 35% helps control expenses without sacrificing quality. Monitoring this KPI allows a restaurant manager to adjust portion sizes, menu prices, or supplier contracts to keep costs in check and protect profit margins.
Cash Flow
Cash flow measures the actual amount of money coming in and going out of your restaurant during a specific period. Positive cash flow means your business has enough funds to cover daily operations, pay staff, and invest in growth.
Formula:
Cash Flow = Cash Inflows – Cash Outflows

Monitoring cash flow is essential to avoid shortages that can disrupt service or delay payments. Effective cash flow management helps restaurant managers maintain steady operations and plan for slow periods or unexpected expenses, ensuring long-term stability in the competitive restaurant industry.
Prime Costs
Prime costs are the combined total of your restaurant’s two largest expenses: labor costs (including wages and benefits) and the cost of goods sold. This KPI is crucial for controlling overall expenses.
Formula:
Prime Costs = Labor Costs + Cost of Goods Sold

Ideally, prime costs should be around 55% to 65% of total sales. Keeping prime costs in check helps improve net profit margin and maintain healthy cash flow. Restaurant managers use this metric to identify inefficiencies in staffing or inventory, making it a vital part of financial planning.
Average Check Size
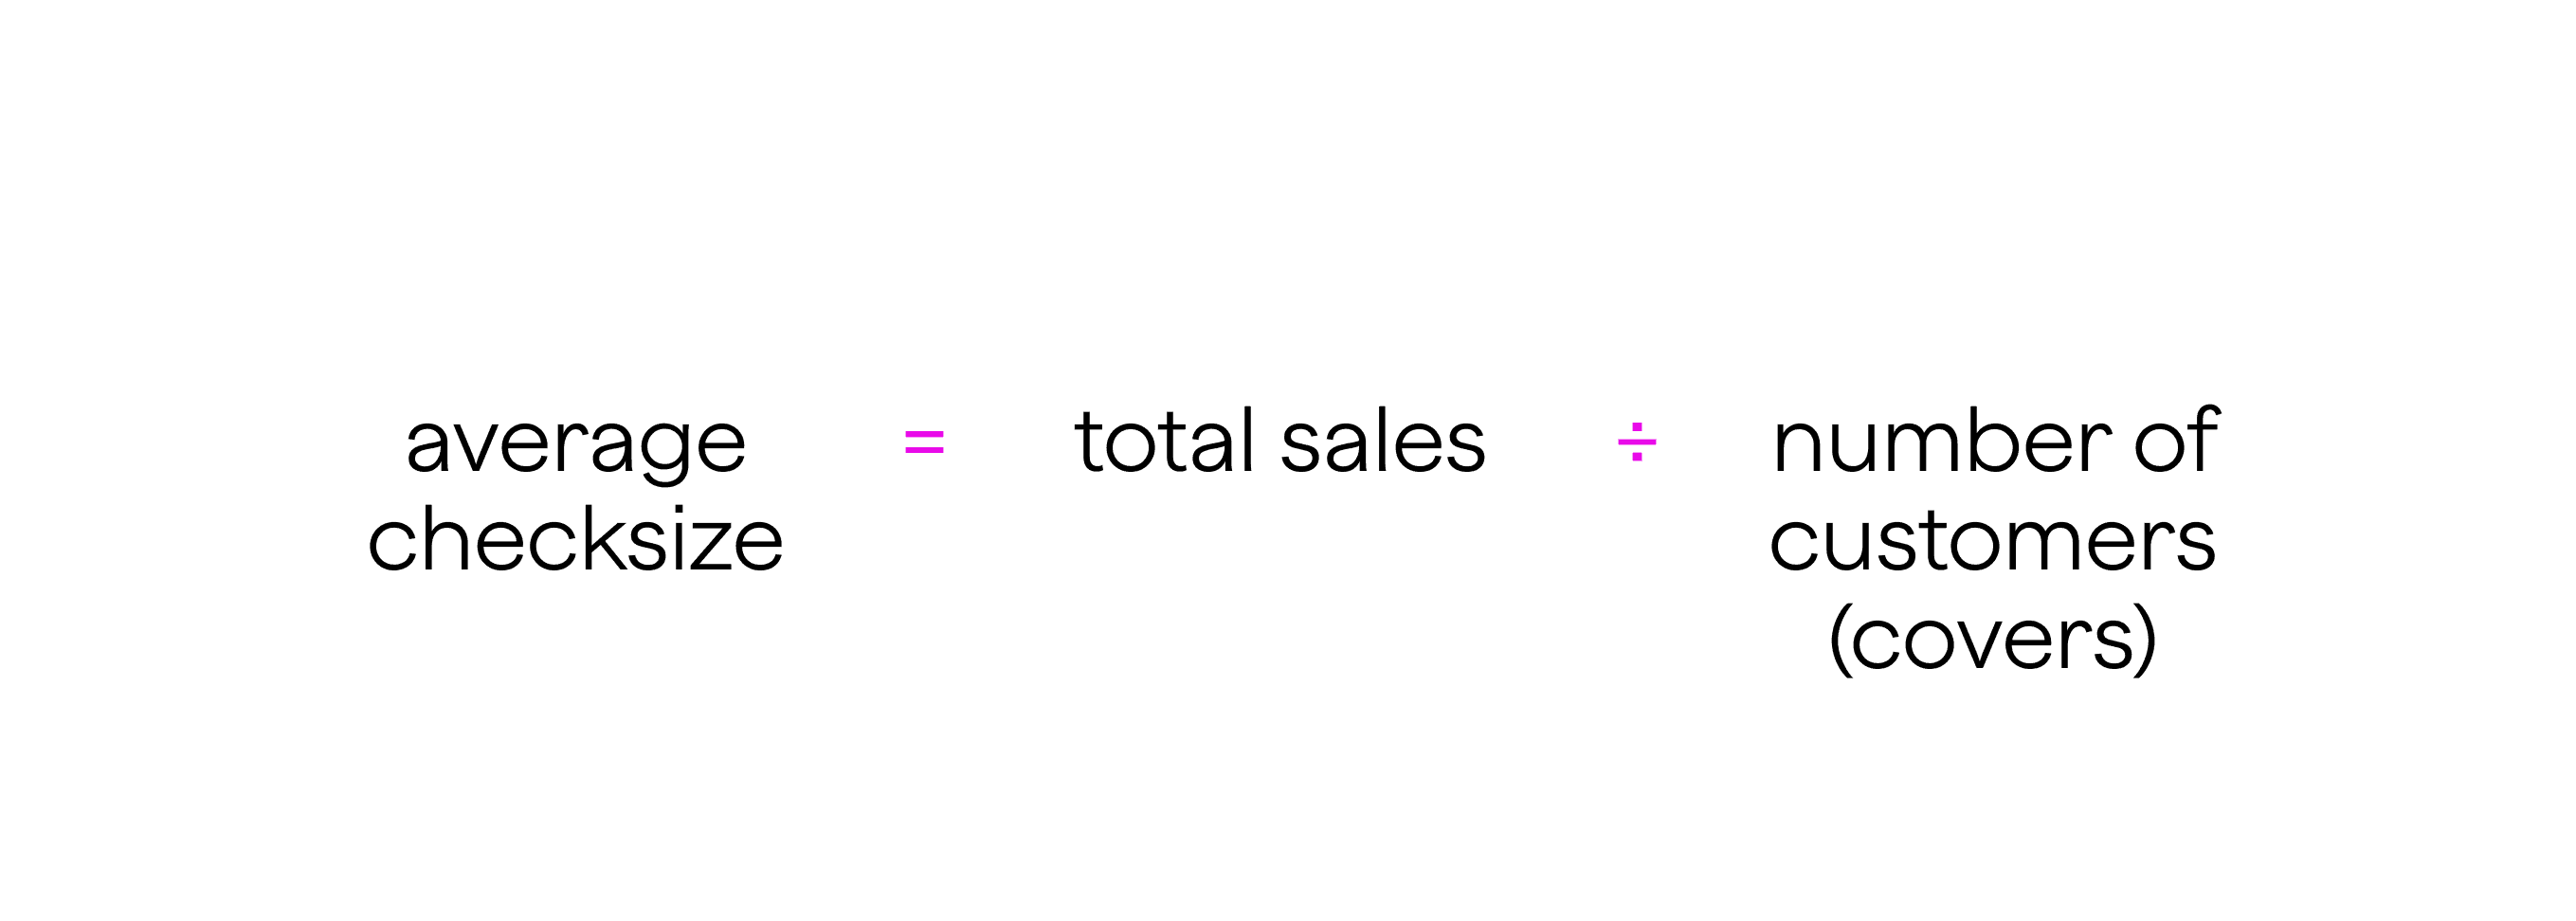
Average check size is the average amount each customer spends per visit. It helps restaurants understand customer spending habits and evaluate the success of upselling or promotions.
Formula:
Average Check Size = Total Sales ÷ Number of Customers (Covers)
Increasing the average check size boosts total sales and overall profitability without increasing the number of customers. Restaurant managers can improve this KPI by offering specials, combo deals, or recommending high-margin menu items, which directly enhances restaurant profit.
Break-even Point
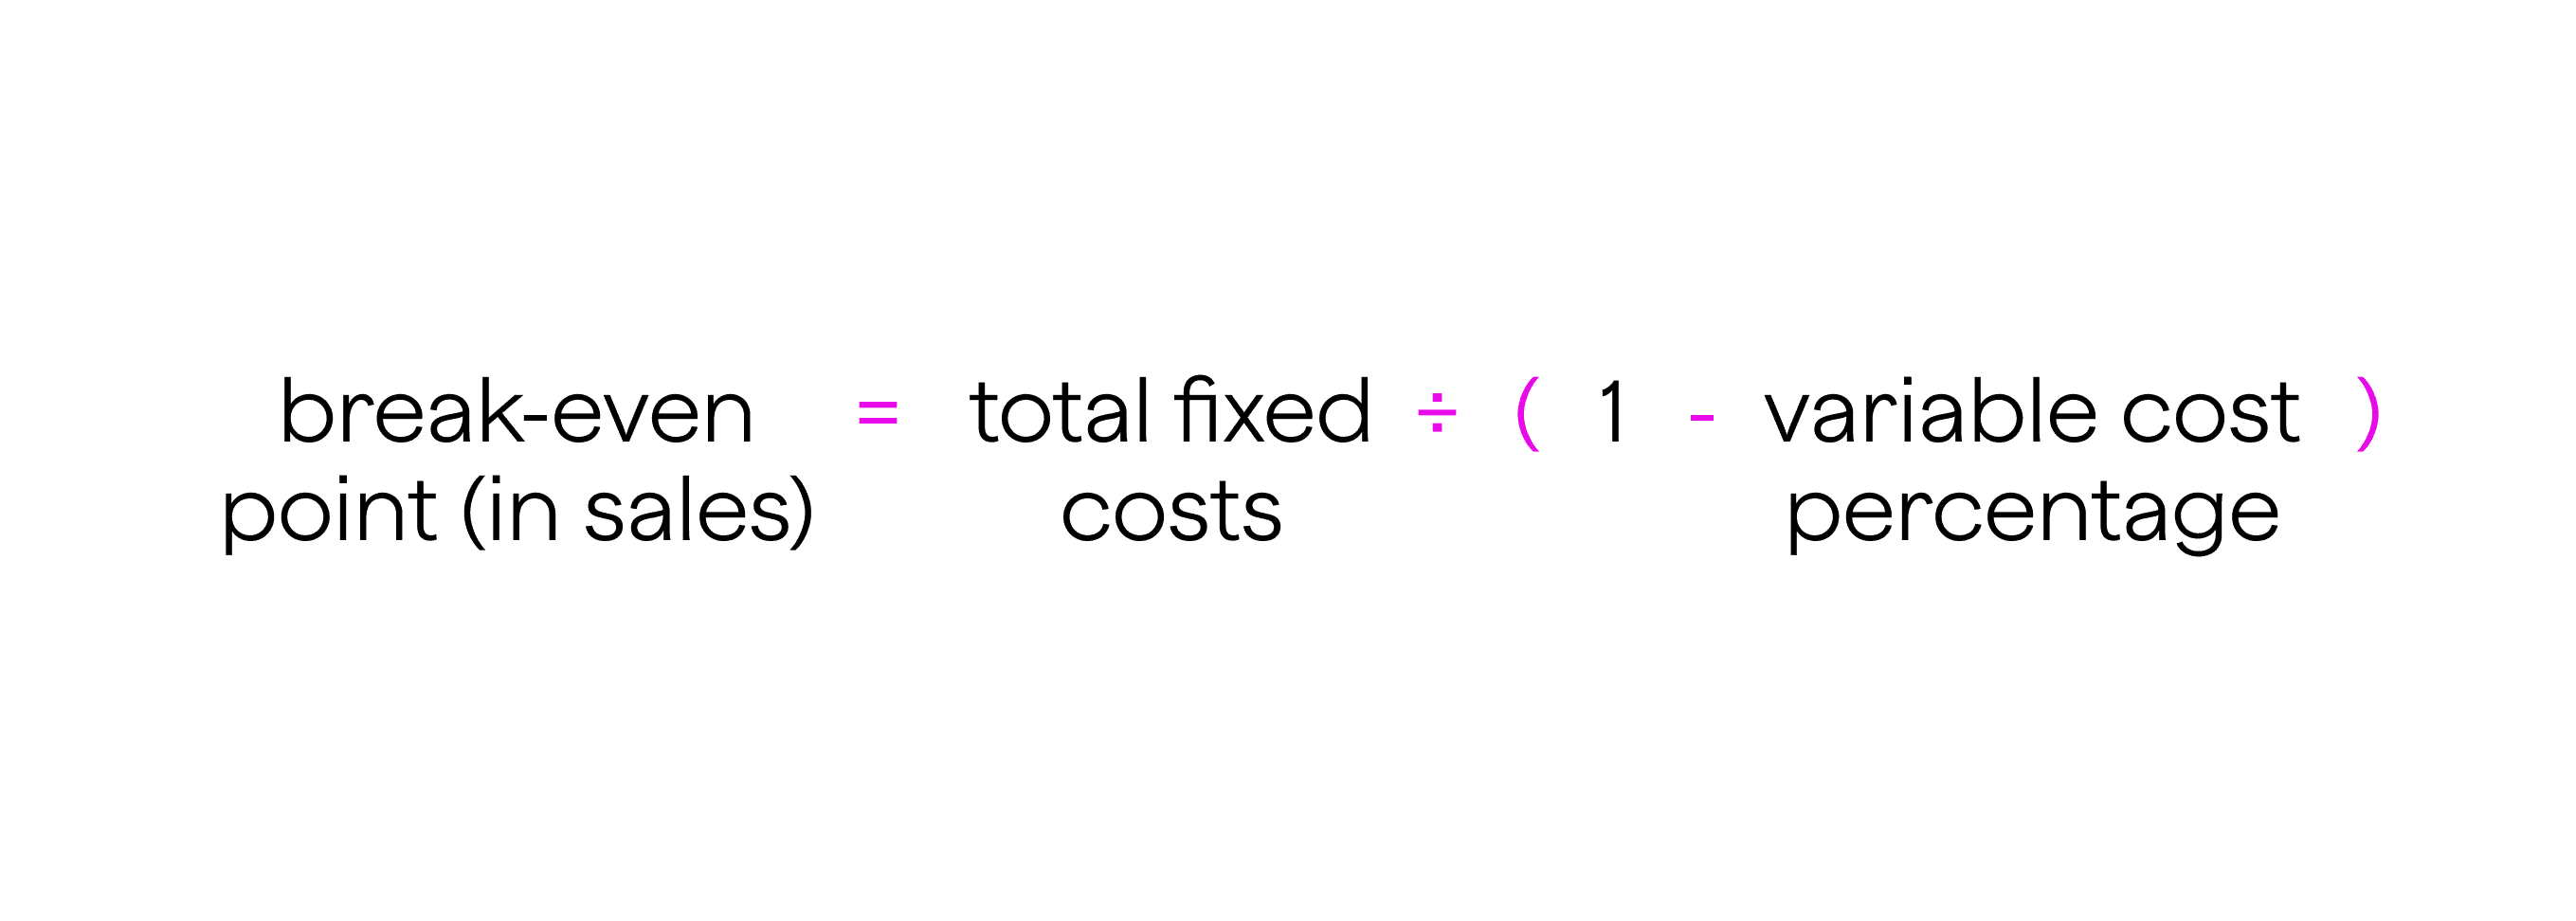
The break-even point is the sales level at which total revenue equals total expenses, meaning the restaurant neither makes a profit nor a loss. Understanding this KPI is essential for setting sales targets and pricing strategies.
Formula:
Break-even Point (in sales) = Total Fixed Costs ÷ (1 – Variable Cost Percentage)
Knowing your break-even point helps restaurant managers plan budgets and marketing efforts more effectively. It ensures that total fixed costs and prime costs are covered, guiding decisions to increase revenue and reduce risks in the competitive restaurant industry.
Revenue per Available Seat Hour (RevPASH)
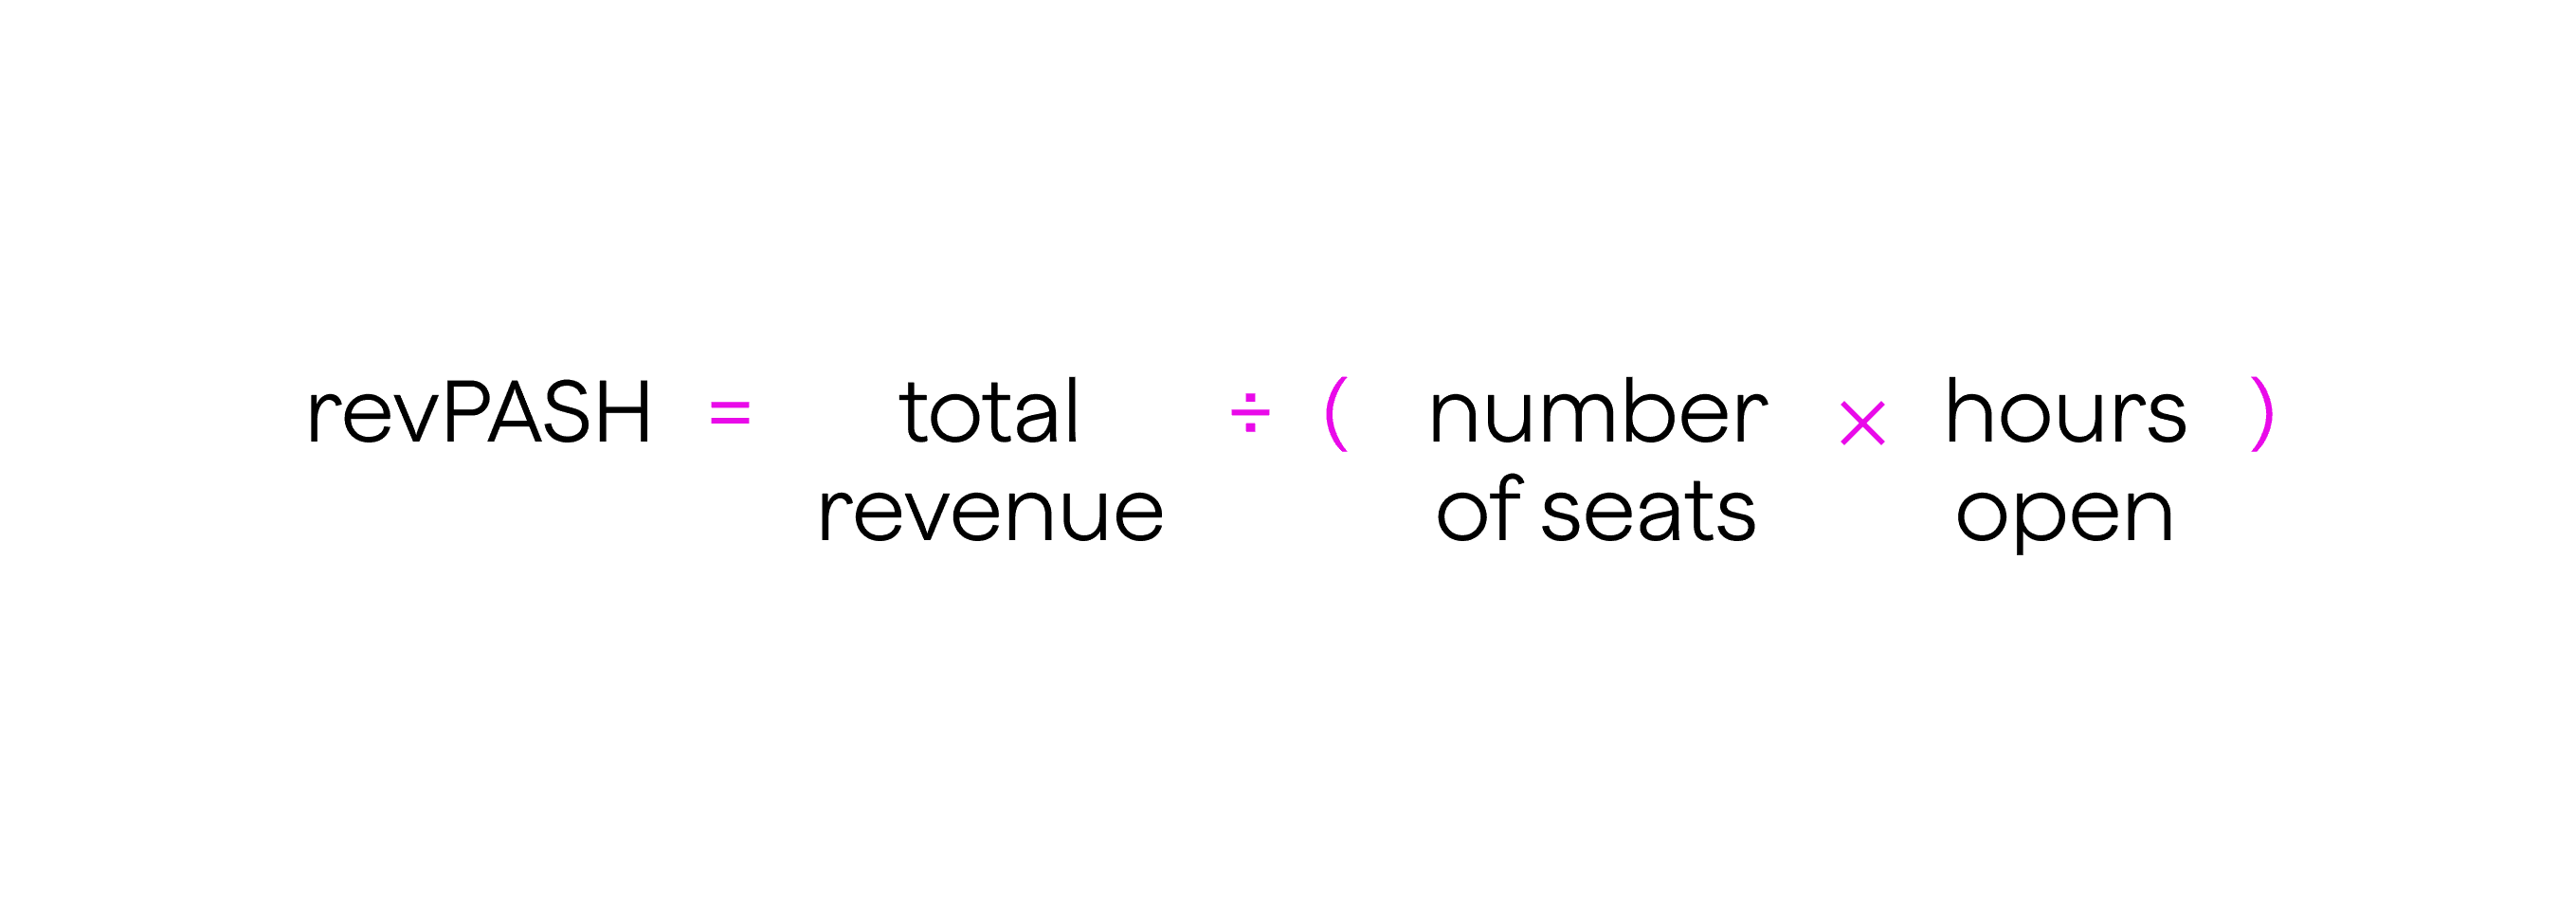
Revenue per available seat hour (RevPASH) measures how much revenue each seat generates per hour of operation. This KPI helps restaurants optimize seating and service efficiency to maximize profits.
Formula:
RevPASH = Total Revenue ÷ (Number of Seats × Hours Open)
Tracking RevPASH enables restaurant managers to identify peak hours and adjust staffing or promotions accordingly. Improving this metric increases total sales without expanding physical space, boosting profit margins and enhancing the overall customer experience.
Conclusion
Tracking the right marketing KPIs for restaurants is essential for long-term success. These key metrics from gross profit margin to revenue per available seat hour provide clear insights into your restaurant’s financial health and customer behavior.
By regularly measuring and analyzing these KPIs, restaurant managers can control costs, improve the customer experience, and make smarter, data-driven decisions. This leads to higher total sales, better profit margins, and a stronger competitive position in the restaurant industry. Start focusing on these KPIs today to turn your restaurant into a thriving, profitable business.