– 8 minute read
Learn how to measure customer loyalty with key metrics like retention, CLV, NPS & referrals. Discover methods to track trust, advocacy & long-term growth.

Tim Kuijlenburg
Author

Customer loyalty is one of those concepts every business talks about, but few measure well. It’s easy to equate loyalty with repeat purchases or positive feedback, yet loyalty goes deeper. It’s about whether your existing customers consistently choose your product or service despite having alternatives - and whether they’re actively recommending your brand to others.
Measuring this isn’t just about pride; it’s about the bottom line. Loyal customers spend more, churn less, and often become advocates, lowering acquisition costs and fueling growth. The challenge lies in deciding which key metrics actually capture loyalty in a reliable and actionable way.
Defining Customer Loyalty from a Metric Point of View
Customer loyalty can feel intangible, but numbers make it real. From a metric point of view, loyalty isn’t just “happy customers.” It’s about behaviors that reflect ongoing trust and preference: repeat purchases, active engagement, referrals, and long-term retention. These signals show whether customers see value in your product or service beyond the first interaction.
The positive side of quantifying loyalty is that it gives businesses clarity - clear benchmarks for success and areas for improvement. On the flip side, no metric tells the whole story. Over-focusing on one (say, Net Promoter Score or repeat purchase rate) can create blind spots, like ignoring customer pain points or missing early signs of churn. A smarter approach is using a mix of key metrics that balance both customer feedback and hard behavioral data.
8 Metrics for Measuring Customer Loyalty
Customer retention rate (CRR) is one of the clearest signals of loyalty. It shows how many existing customers stay with you over a specific period compared to how many you started with. A high retention rate demonstrates that customers continue to see value in your product or service, which strengthens revenue stability and reduces reliance on constant new acquisition.
The limitation is that retention doesn’t show the quality of the relationship. A customer may remain active in name only while spending less each year. Without deeper context, a retention figure could mask the fact that customer churn is slowly eroding growth. The best way to strengthen this metric is to track it in combination with customer lifetime value (CLV), so you can see not just who stays, but whether they keep contributing meaningfully to your bottom line.
Repeat Purchase Rate vs. Retention: What’s the Difference?
Repeat purchase rate (RPR) looks specifically at how many customers come back to buy again. Unlike retention, which can include passive customers, RPR is rooted in action. For businesses where frequent buying is natural - like grocery or coffee shops - it’s one of the most telling measures of loyalty.
On its own, however, RPR can be misleading. Customers might repeat purchases because they lack alternatives rather than because they feel genuine loyalty. That means high numbers don’t always equal advocacy or brand trust. To make RPR more meaningful, compare it to metrics like Net Promoter Score (NPS) or referral rate. This way, you can tell whether repeat customers are also recommending your brand or simply returning out of habit.

Customer Churn Rate: Spotting Loyalty Red Flags
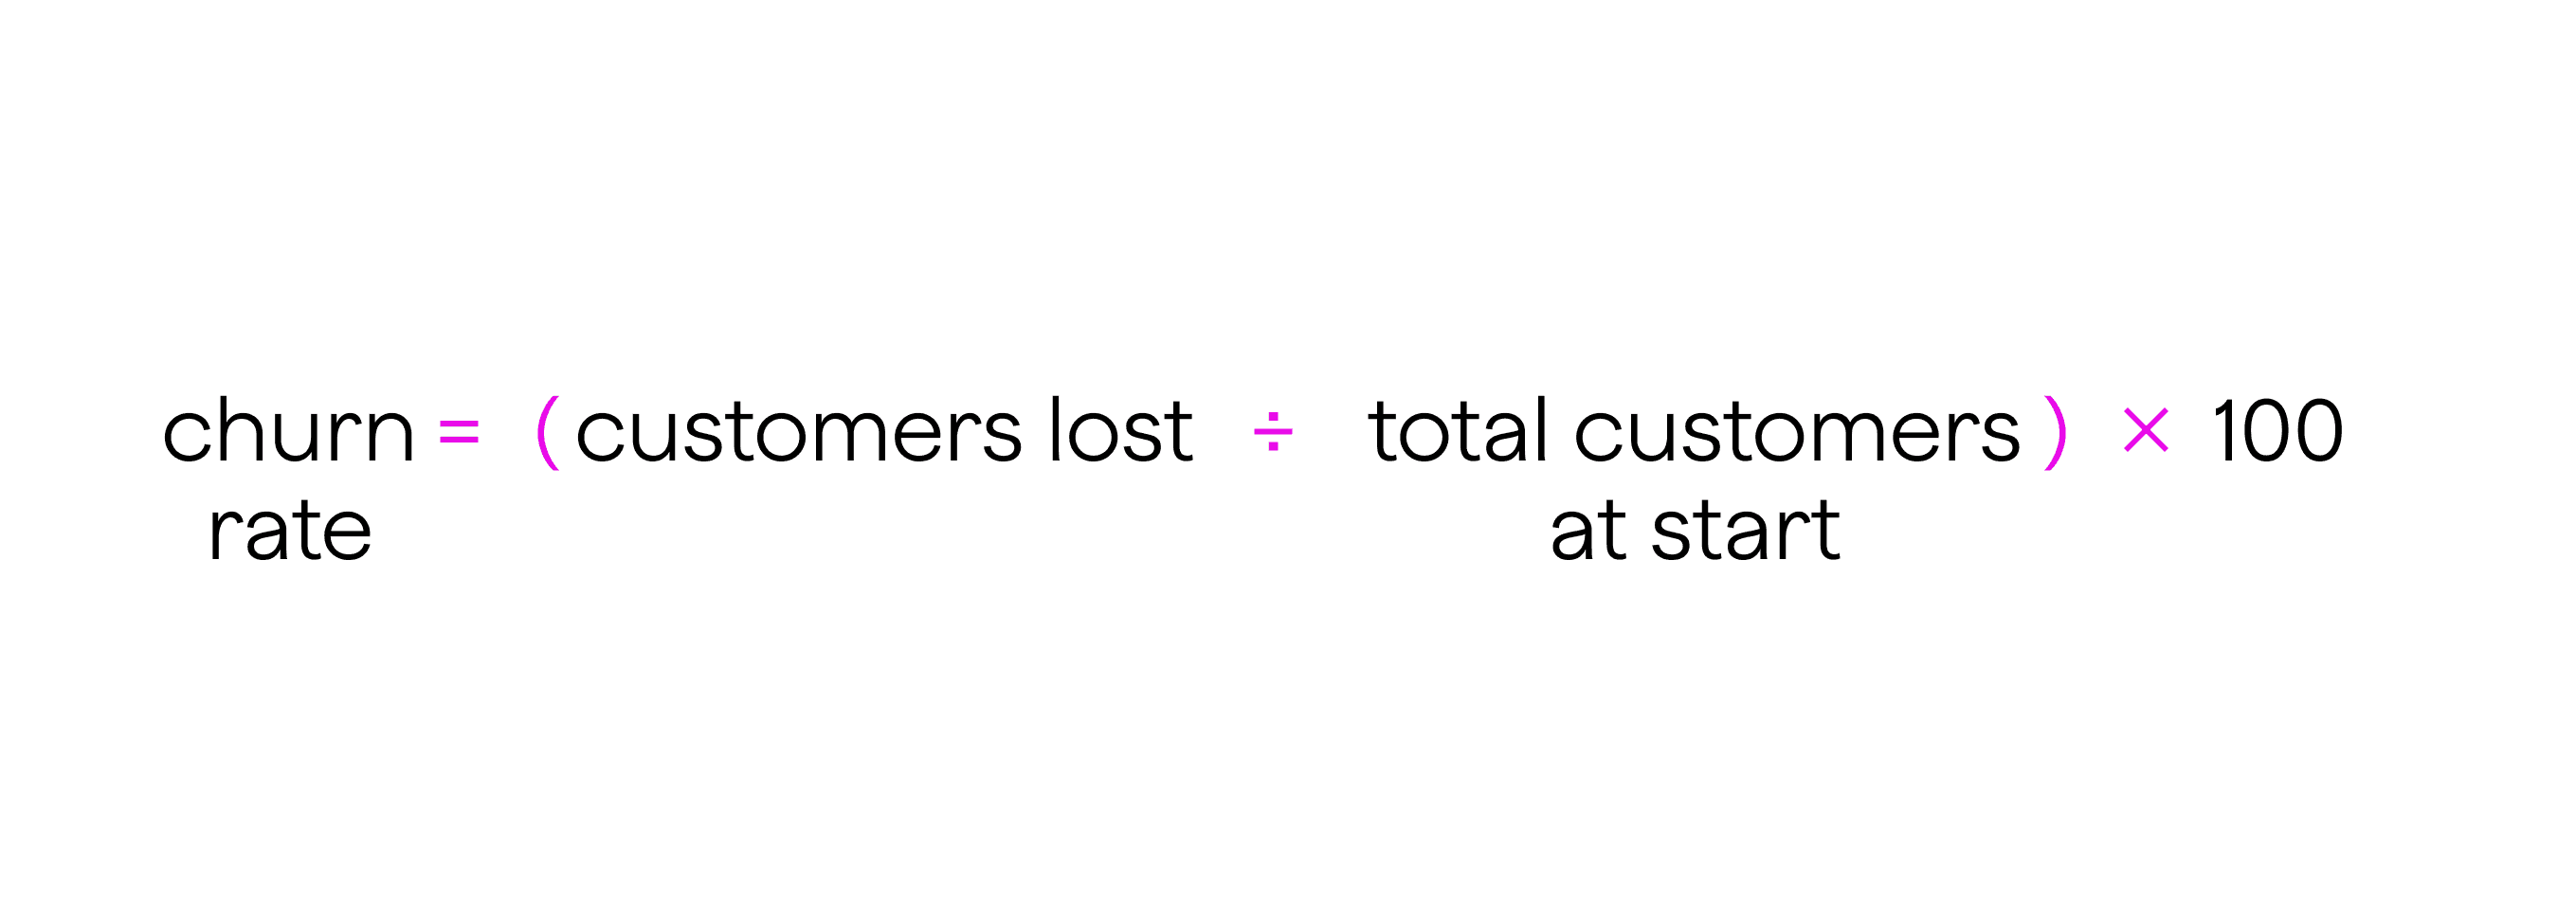
Customer churn rate captures how many customers stop using your product or service over a set timeframe. It’s often seen as the opposite of retention. Rising churn is a clear red flag because it erodes long-term growth and signals dissatisfaction with your product, service, or overall experience.
That said, churn isn’t always straightforward to measure. For subscription-based businesses, cancellations are obvious, but for others - like retailers or durable goods sellers - it can be harder to define when a customer is truly lost. Looking at churn both quarterly and annually provides a more reliable view, since it helps identify short-term spikes while also surfacing long-term patterns. Segmenting churn by customer groups or products can highlight where pain points are concentrated.
Net Promoter Score (NPS): Measuring Brand Advocacy
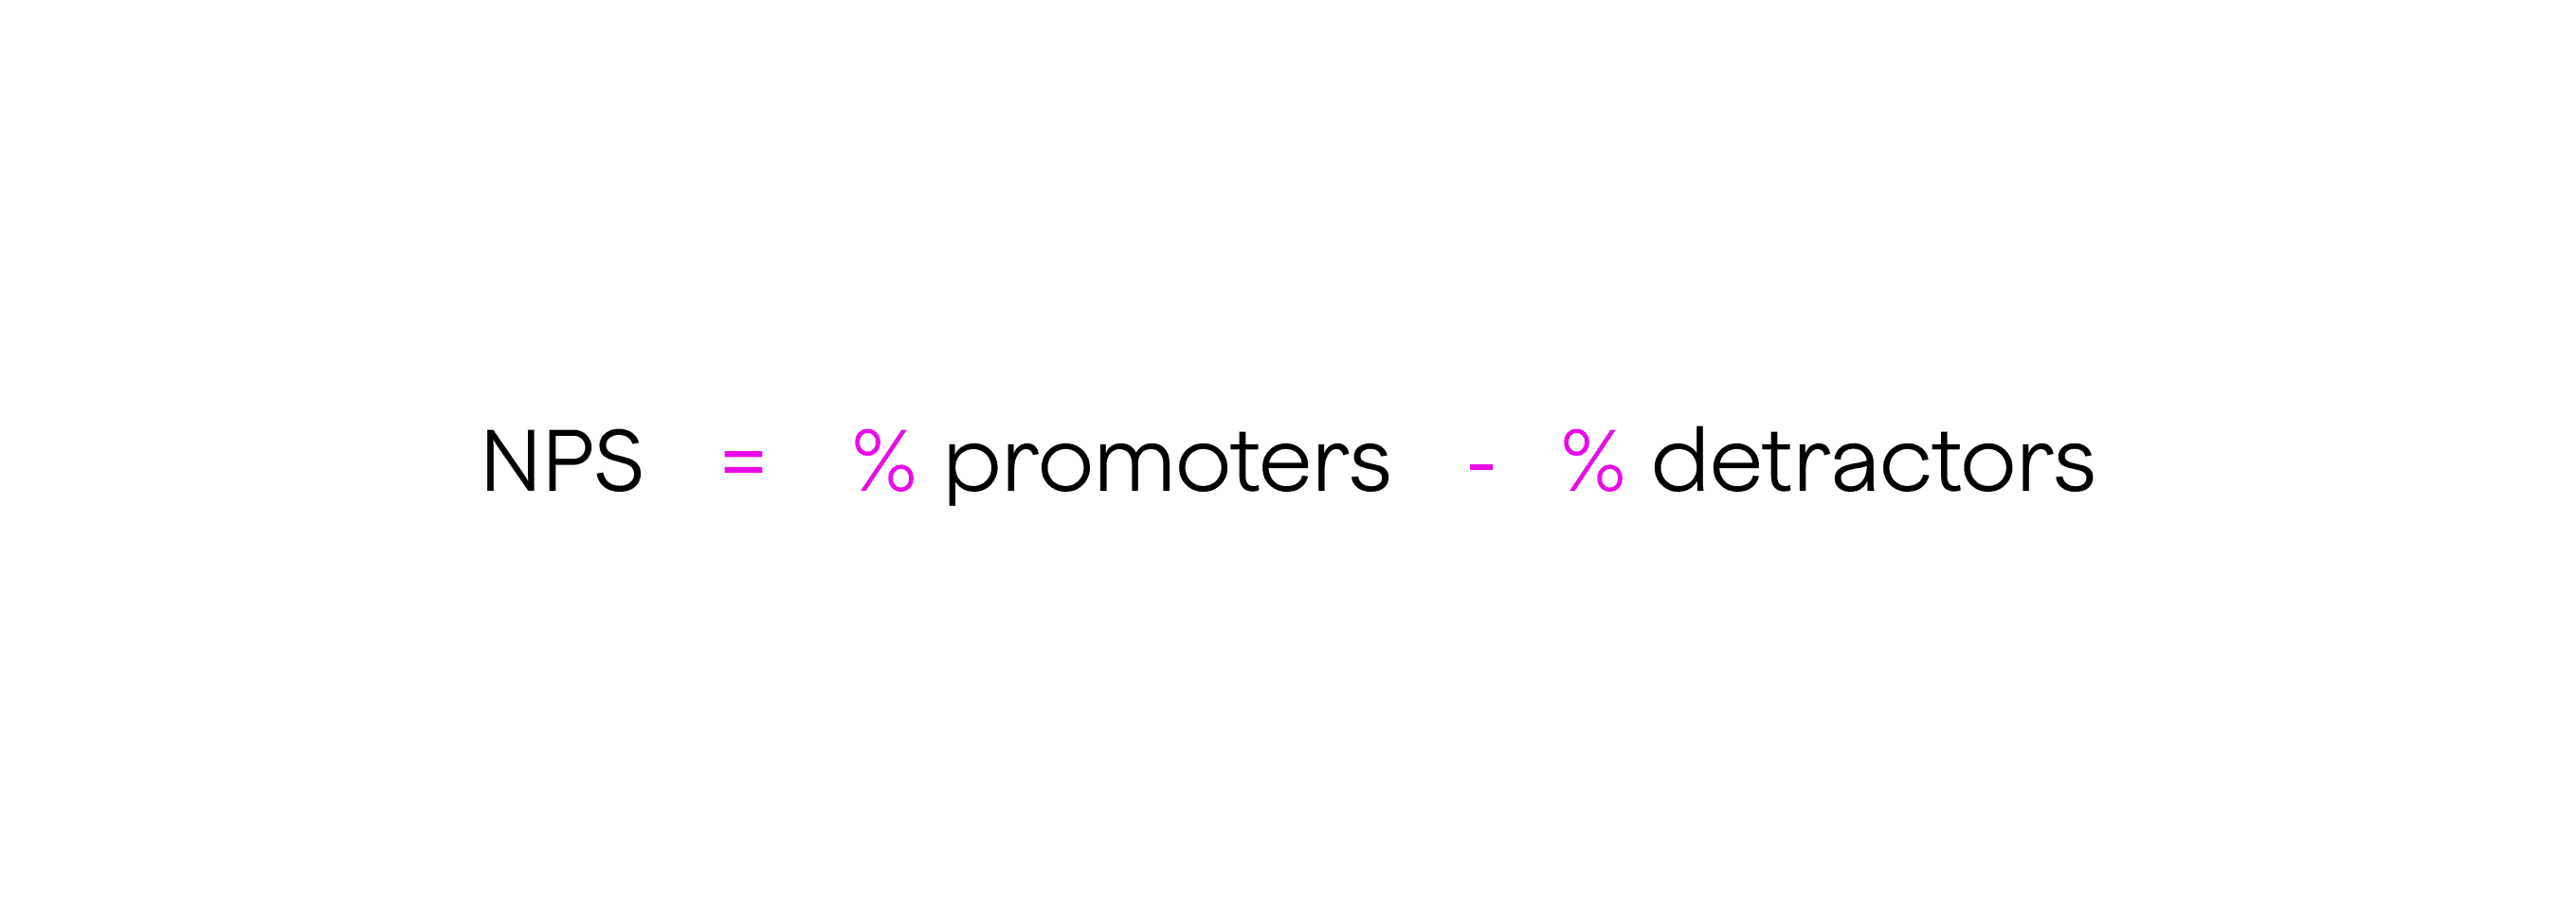
Net Promoter Score asks one deceptively simple question: “How likely are you to recommend our brand to a friend or colleague?” It’s a powerful tool because it measures advocacy, not just satisfaction. Customers who are willing to put their name on the line by recommending you are usually demonstrating a deeper form of loyalty.
The challenge with NPS is that it captures intent, not behavior. Someone may score you highly but never actually promote your brand in real life. Others may give a neutral score while still being loyal buyers.
To get real value from NPS, it helps to validate results with hard data - like whether promoters are also participating in referral programs or leaving public reviews. Bain & Company research suggests that businesses combining NPS with behavioral data see the strongest link to growth, rather than relying on it in isolation.
Customer Satisfaction Score (CSAT): Customer Experience in Numbers
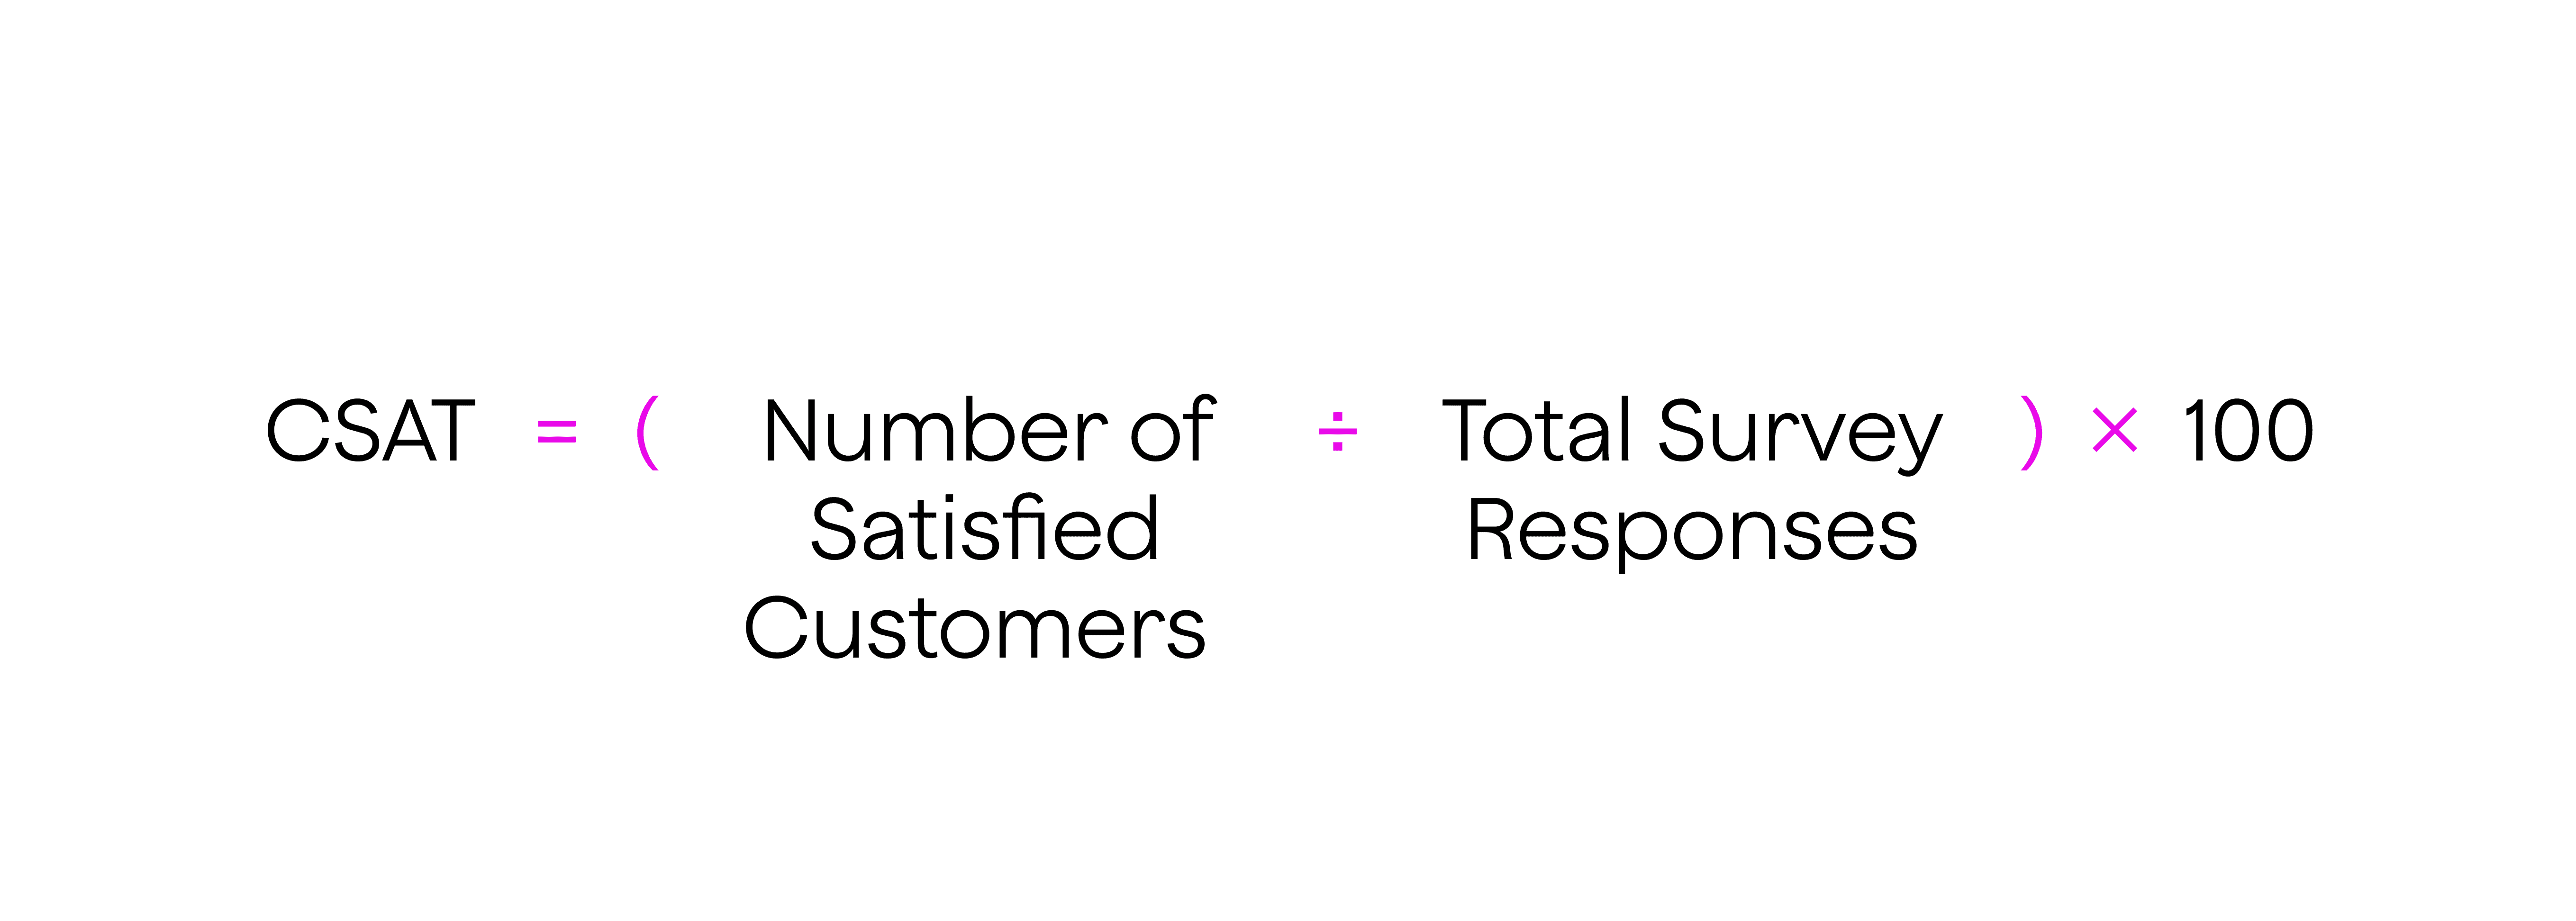
Customer satisfaction score (CSAT) is typically measured through short surveys following a purchase or service interaction. It’s one of the most immediate ways to capture customer feedback and can highlight whether specific touchpoints - like customer service or product delivery - are meeting expectations.
The limitation is that CSAT is situational. A customer might give a positive score after a single transaction yet still leave for a competitor later. Conversely, a bad day or isolated issue could result in a poor score from an otherwise loyal customer. The best way to use CSAT is as a tactical measure to monitor service performance, while keeping in mind that satisfaction doesn’t always translate into long-term loyalty.
Customer Lifetime Value (CLV): Connecting Loyalty to the Bottom Line
Customer lifetime value estimates how much revenue a customer will generate across their entire relationship with your brand. It’s one of the most comprehensive loyalty metrics because it connects customer behavior directly to financial outcomes. Repeat purchases, cross selling, and referrals all increase CLV, making it a true reflection of long-term impact.
The downside is that CLV can be tricky to calculate accurately, especially for businesses with complex customer journeys. Relying on assumptions about how long customers stay can easily lead to inflated projections. To make CLV actionable, use it for segmentation. Identify your “true friends” - customers with both high loyalty and profitability - and focus retention and marketing strategies on deepening those relationships.

Active Engagement Rate: Beyond Repeat Purchases
Active engagement rate tracks how often customers interact with your brand outside of purchases. It can include loyalty program activity, email open rates, or social media participation. Engagement shows whether customers are leaning into the relationship rather than remaining passive, and engaged customers tend to buy more, give more feedback, and respond better to new offers.
The challenge is that engagement doesn’t always equal loyalty. People may interact with your content without any intention to buy again. For example, someone may like your posts on social media because they enjoy your voice, not because they’re a repeat customer.
To ensure engagement has real value, connect engagement metrics to financial indicators such as repeat purchase rate or CLV. This shows whether higher engagement is truly driving long-term business outcomes.
Referral Rate: Measuring Word-of-Mouth Loyalty
Referral rate measures how often customers actively bring in new business, whether through a formal referral program or informal word-of-mouth. Referrals are one of the strongest demonstrations of loyalty, because recommending a product or service carries personal risk - people rarely do it unless they genuinely trust your brand.
The challenge is measurement. Unless you have a tracked referral program, it can be difficult to know how many new customers came from personal recommendations. Even with a program, referrals alone don’t necessarily indicate long-term loyalty; some customers might refer once and never buy again themselves.
To strengthen this metric, implement a structured referral program and then tie referral data back to CLV. This reveals whether referred customers are as valuable - or even more valuable - than those acquired through other channels.
How to Implement These Metrics
Knowing how to measure customer loyalty is one thing - putting it into practice is another. The key is to set up systems that make data collection easy, reliable, and actionable. Below are practical ways to implement each of the eight loyalty metrics, showing how they fit together for a complete picture.
Tracking Customer Lifetime and Retention Rate
The foundation of loyalty measurement starts with understanding how long customers stay with you. By tracking the average customer lifetime and your overall retention rate, you can see whether people are sticking around after their first experience.
Retention rate is simple to calculate: take the number of customers at the end of a period, subtract new customers gained, and divide by the number you had at the start. Tracking this over time gives you a trend line that can reveal whether marketing strategies and customer service improvements are paying off.
To make this metric more actionable, tie it directly to customer lifetime value (CLV). A stable retention rate paired with a growing CLV shows not only that customers are staying, but that they’re spending more throughout their relationship. Conversely, a flat or falling CLV despite strong retention could mean you need to focus on cross selling or improving average order value.
Analyzing Purchase Data to Measure Repeat Purchases
Purchase history is one of the most direct ways to assess loyalty. By analyzing purchase data, you can calculate your repeat purchase rate (RPR) - the percentage of customers who buy again after their first transaction. This is especially useful for businesses with products or services designed for regular consumption.
Purchase data also gives you insights beyond frequency. Looking at what customers buy again and again highlights where your product or service has the strongest pull. If repeat purchases cluster around a particular category, you can build marketing strategies that amplify those strengths.
It’s also worth looking at the timing between purchases. Shortening the average time between repeat purchases, perhaps with targeted offers or reminders, can be just as valuable as increasing overall RPR.
Measuring Customer Churn Quarterly and Annually
Churn is the flip side of retention, and regular measurement is critical. Checking churn quarterly helps you spot sudden shifts, such as a spike after a price increase or product update. Annual measurement, on the other hand, smooths out short-term volatility and reveals the longer-term trajectory.
The key to making churn data useful is segmentation. Instead of looking only at overall churn, break it down by product line, customer type, or acquisition channel. This shows you where loyalty is weakest. For example, if customers acquired through paid ads churn faster than those who arrive through referrals, you may want to revisit your acquisition strategy.
Churn also pairs well with CSAT and NPS data. If you see churn increasing in a group that has also reported lower satisfaction scores, you know service or product quality is likely the culprit.
Using Surveys to Capture Net Promoter Score (NPS)
Surveys are the simplest way to measure NPS. Asking the “likelihood to recommend” question via email or in-app prompts makes it easy to gather data from a large sample.
The real value of NPS comes when you look beyond the number. Segment responses into promoters, passives, and detractors, then link those groups back to actual behaviors like repeat purchases, engagement rates, and referrals. If your promoters are also your highest-spending customers, that’s a sign of strong advocacy. If detractors are churning faster, their feedback can highlight pain points worth addressing immediately.
To close the loop, follow up with open-text survey questions. Understanding why customers gave a score is just as important as the score itself, and those insights can guide both product improvements and customer service strategies.
Measuring Customer Satisfaction (CSAT) After Key Interactions
CSAT surveys should be short and targeted. A quick “How satisfied were you with your purchase or service today?” rating after checkout or a customer service call can provide an ongoing pulse on satisfaction.
To connect CSAT to loyalty, track whether satisfied customers also exhibit higher retention or repeat purchase rates. A consistently high CSAT score across your service channels is a strong indicator that your customer experience is aligned with loyalty. Conversely, if churn remains high despite strong CSAT results, it may mean satisfaction isn’t translating into long-term value - perhaps because your product doesn’t address evolving customer needs.
Launching a Loyalty Program with Engagement Tracking
Loyalty programs are a practical way to boost both engagement and repeat purchases while also providing measurable data. By tracking signups, logins, and redemptions, you gain visibility into your active engagement rate - how often customers are interacting beyond the initial purchase.
To make this more valuable, design the program so it ties into other metrics. For example, monitor whether loyalty program members show higher CLV or lower churn than non-members. This can validate the program’s impact and highlight opportunities to optimize benefits. You can also use engagement data to personalize marketing strategies, sending tailored offers based on customer behavior.
Implementing a Tracked Referral Program
Referrals are often one of the clearest signs of loyalty, but they’re difficult to measure without a structured system. A tracked referral program solves that by giving customers a unique link or code they can share with friends. This not only helps measure referral rate but also gives you insight into the quality of referred customers compared to those acquired through other channels.
To strengthen the program, connect referrals back to NPS. Customers who rate you highly on the likelihood-to-recommend question should also be the ones most engaged in referral activity. If they’re not, it may indicate a gap between stated intent and actual behavior. Addressing that gap - perhaps by simplifying the referral process or offering stronger incentives - can turn passive promoters into active advocates.
Bringing the Metrics Together
Each implementation step becomes more powerful when tied back to the others. Retention and churn tell you who’s staying or leaving, while purchase data and loyalty programs show how often customers buy. NPS and CSAT capture customer feedback, but they gain weight when validated against engagement and referral activity. CLV ties everything to the bottom line, showing which customer groups deliver the greatest long-term value.
By combining these approaches, you move from simply collecting numbers to creating a loyalty measurement system that informs strategy. The result is a clearer picture of your customer relationships - one that goes beyond short-term satisfaction to reveal the behaviors, advocacy, and financial impact that define true loyalty.
Combining These Metrics for a Clearer Picture
When exploring how to measure customer loyalty, it’s important to remember that no single metric is perfect. Retention may show that customers are staying, but it won’t reveal if they’re spending less. NPS can indicate strong advocacy, yet doesn’t guarantee repeat purchases.
The most accurate view comes from combining metrics into a portfolio. Which ones you prioritize depends on your goals: retention and CSAT are useful for reducing churn, CLV and repeat purchase rate help track long-term revenue growth, and referral rate or NPS highlight advocacy.
Some measures - like CLV, repeat purchases, and referrals - are relevant to almost every business because they link loyalty directly to growth. Looking at them alongside engagement or satisfaction scores helps reveal contradictions, such as customers who like your brand but don’t buy again. Spotting these gaps is where loyalty strategies become actionable.
Gauging Loyalty with Customer Relationship Groups
Beyond the above metrics, another way to make sense of customer loyalty is by grouping customers into relationship groups. This model, often used in marketing and loyalty research, helps businesses understand not just the numbers, but the nature of the customer relationship itself.
Strangers
These are the people who interact with your brand once but never return. They may make a single purchase or trial, but the relationship ends quickly. While every business has strangers, relying too heavily on them for revenue is risky, since acquisition costs are high and loyalty is nonexistent. Metrics like churn rate and repeat purchase rate often make strangers visible.
Barnacles
These customers stick around but contribute little. They may have a high retention rate but low CLV because they rarely buy or engage. These customers aren’t necessarily negative, but they can drain resources if you over-invest in them. Engagement rate and purchase data are helpful in identifying barnacles - customers who stay on the books but don’t contribute meaningfully to the bottom line.
Butterflies
Attractive but fleeting. They make large purchases, sometimes at high value, but don’t stick around. While they boost revenue in the short term, their churn rate is high. Relying on butterflies can create false optimism about growth. The key metrics here are CLV and retention rate; butterflies may look profitable at first, but over time they contribute less.
True Friends
These are the customers every business wants. They buy regularly, engage with your brand, and are more likely to recommend you to others. Their CLV is high, their repeat purchase rate is consistent, and they often generate referrals. These are the customers who create the strongest impact on your bottom line and who should be at the center of your loyalty strategies.
When metrics and relationship groups are combined, businesses get both a quantitative and qualitative understanding of loyalty. Metrics show the measurable outcomes - repeat purchases, referrals, CLV - while relationship groups explain the behavior behind the numbers. Together, they provide the clarity needed to design loyalty strategies that go beyond short-term gains and instead build lasting, profitable customer relationships.
Conclusion
Measuring customer loyalty isn’t about chasing one perfect number - it’s about weaving together metrics and relationship insights to understand the full picture. When you balance data like retention, CLV, and referrals with the context of customer groups, you move beyond tracking transactions to building stronger, lasting relationships. The result is not just loyal customers, but a healthier bottom line and a brand people genuinely want to stick with.


